- Search Metals Mine
- 20 Results
-
 BFried replied Oct 10, 2007
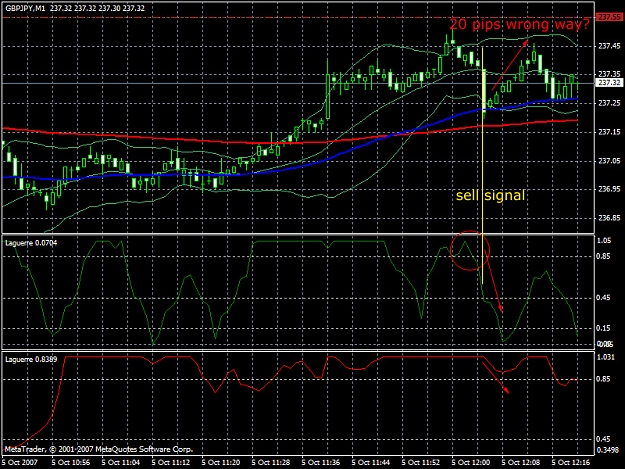
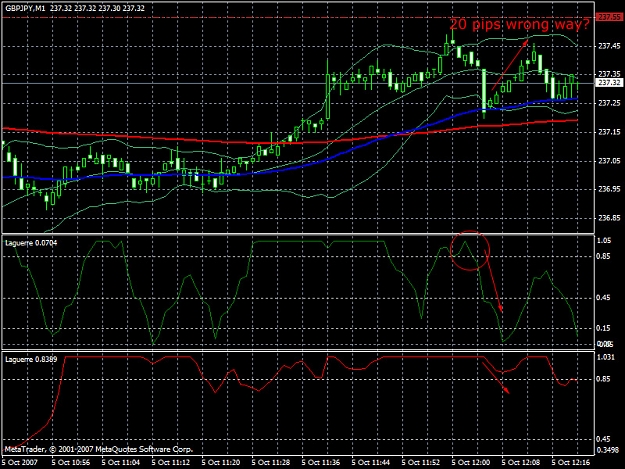
Here's an example of how the rules keep you out of a trade that could go bad. If you look at this chart, this is a classic SELL indicator. It doesn't get much more obvious than this. However, we have 2 rules that would be broken if we take this ...
Simple Method of Scalping any pair on 5 min chart , specially GBP/JPY - by Imran Sait
- BFried replied Oct 10, 2007
It makes perfect sense and it happened to me. I just saw a really good sell indicator and had I not been so shell shocked from earlier today I would have jumped in. I trust the indicators, I just don't trust myself.
Simple Method of Scalping any pair on 5 min chart , specially GBP/JPY - by Imran Sait
- BFried replied Oct 9, 2007
Just made a quick 20 pips on this move before the US market closed.
Simple Method of Scalping any pair on 5 min chart , specially GBP/JPY - by Imran Sait
- BFried replied Oct 9, 2007
Imrain, The lags were showing sell, nearest support was 30+ pips away, and this trade never went in the direction indicated... lost 19 pips. This trade essentially wiped out my sucessful trade I had earlier. I entered on the first line, stop loss ...
Simple Method of Scalping any pair on 5 min chart , specially GBP/JPY - by Imran Sait
- BFried replied Oct 9, 2007
Imrain, What do you think about this for a short entry? Is it a no-go because the EMA's don't agree and Daily Pivot is only 8 pips away? If it breaks the daily pivot would you jump in then?
Simple Method of Scalping any pair on 5 min chart , specially GBP/JPY - by Imran Sait
- BFried replied Oct 9, 2007
Just went long, it broke S3 and weekly pivot. Looking to TP around 237.91 (5 pips below S2). As I suspected, lag 2 is now starting to point up.
Simple Method of Scalping any pair on 5 min chart , specially GBP/JPY - by Imran Sait
- BFried replied Oct 9, 2007
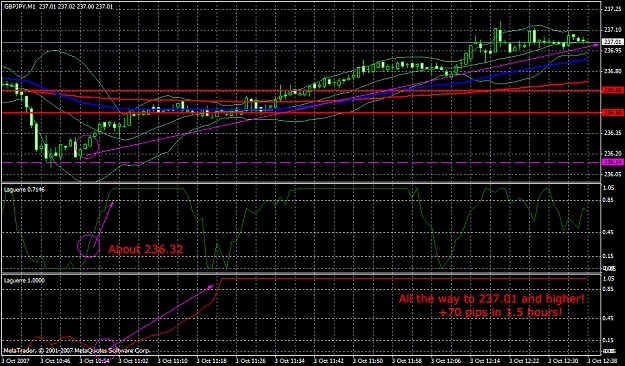
Here's a new chart that follows the last one I posted. You can see how strong the Lag 1 is, but it's just not enough to break S3. It's gone all the way to 1.0 and the price is still bouncing off S3. It may get enough momentum to break it, but I ...
Simple Method of Scalping any pair on 5 min chart , specially GBP/JPY - by Imran Sait

- BFried replied Oct 9, 2007
Imrain, I'd like to confirm my logic with you on this chart. There was a very clear BUY signal from the lags, but I didn't take this trade. If you look at the end of the chart, this is a classic buy scenario if you only use lags. However, the price ...
Simple Method of Scalping any pair on 5 min chart , specially GBP/JPY - by Imran Sait
- BFried replied Oct 8, 2007
Imrain, Take a look at this chart, at the very end. The blue lag just went up above 0.15 right after I took the pic, I was thinking about entering, but the EMA just crossed suggesting a downward trend...does that mean I shouldn't do it? (The EMA ...
Simple Method of Scalping any pair on 5 min chart , specially GBP/JPY - by Imran Sait
- BFried replied Oct 8, 2007
I hesitated and missed out on a big move... 100+ pips or so bounce off the daily R1. I didn't enter at first because I wanted it to break the blue EMA, then I hesitated to pull the trigger and decided to wait for it to break red EMA. Then I figured ...
Simple Method of Scalping any pair on 5 min chart , specially GBP/JPY - by Imran Sait
- BFried replied Oct 8, 2007
Something is definitely wrong... If I use the metaquotes demo server, my chart looks like #1 (normal?). If I use the northfinance demo server, my cart looks like #2 (broken?). Why would changing the server make such a huge difference, and how do I ...
Simple Method of Scalping any pair on 5 min chart , specially GBP/JPY - by Imran Sait
- BFried replied Oct 8, 2007
Imran, Is there something wrong with my daily pivot indicator? It shows the daily pivot at 238.5, R1 @ 238.95, R2 @ 239.02, R3 @ 239.12 Why would R2 be 7 pips from R1, and R3 be 10 pips from R2??? This seems wrong, but I don't know. If these are ...
Simple Method of Scalping any pair on 5 min chart , specially GBP/JPY - by Imran Sait

- BFried replied Oct 5, 2007
If you look at the chart again, my entry wouldn't have been at 237.40. The sell signal came at about 237.25, then 5 minutes later it went up to 237.48, which would have triggered my S/L. I've marked up my chart even more to further illustrate this. ...
Simple Method of Scalping any pair on 5 min chart , specially GBP/JPY - by Imran Sait
- BFried replied Oct 5, 2007
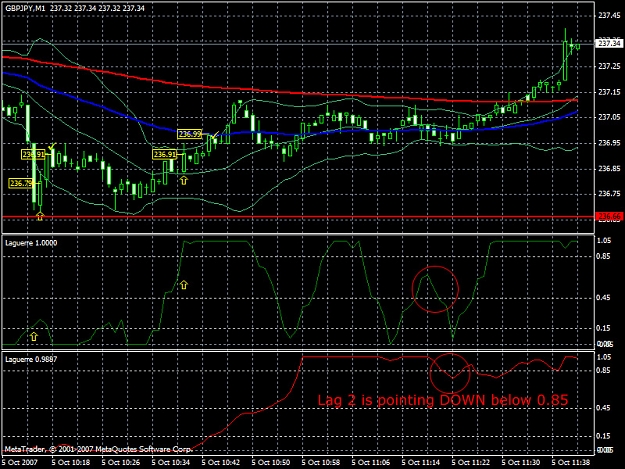
Here's another question that might help some other people. Look at the very end of the first chart. Is this a valid SELL signal or does the red lag need to be above .45 when pointing down? I didn't take this trade because I assumed it had to be ...
Simple Method of Scalping any pair on 5 min chart , specially GBP/JPY - by Imran Sait
- BFried replied Oct 5, 2007
Sorry to bug you with so many posts Imrain... Can you take a look at this chart? I didn't act on this, but could this be a false sell indication? I RARELY see a false indicator with your lag setup, but isn't this a valid sell? While I'm sure this ...
Simple Method of Scalping any pair on 5 min chart , specially GBP/JPY - by Imran Sait
- BFried replied Oct 5, 2007
Thanks Imran, I wasn't at my computer yet so that first trade you showed wasn't possible. I wish I had been there
Simple Method of Scalping any pair on 5 min chart , specially GBP/JPY - by Imran Sait. Do you think getting the 11 pips on the rebound of that huge movement was a good idea, or risky? As for the second trade, I was ...
- BFried replied Oct 5, 2007
Imran, I was wondering what you thought of these two scalps. Were they too risky? Were they OK because the indicators were right? The result was positive, but I'd still like you input. I put a yellow up arrow where I entered and a yellow check mark ...
Simple Method of Scalping any pair on 5 min chart , specially GBP/JPY - by Imran Sait
- BFried replied Oct 4, 2007
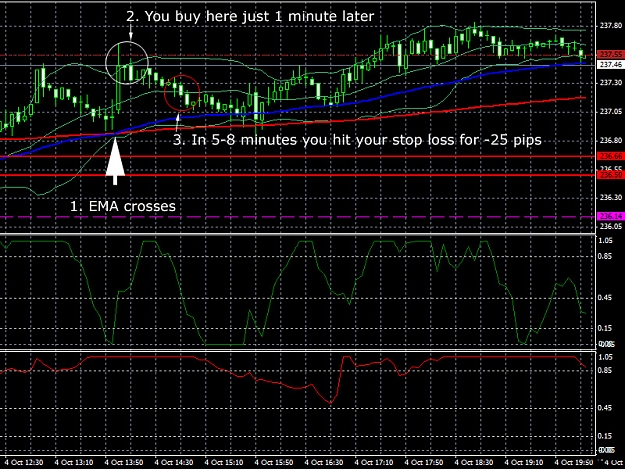
Here's an example of what I'm talking about with the EMA. Look at this chart. The EMA crosses, there's a HUGE upward candle during the same 1 minute period. You see the EMA crossed, your indicator makes it's sound, so you buy. It never moves a ...
Simple Method of Scalping any pair on 5 min chart , specially GBP/JPY - by Imran Sait
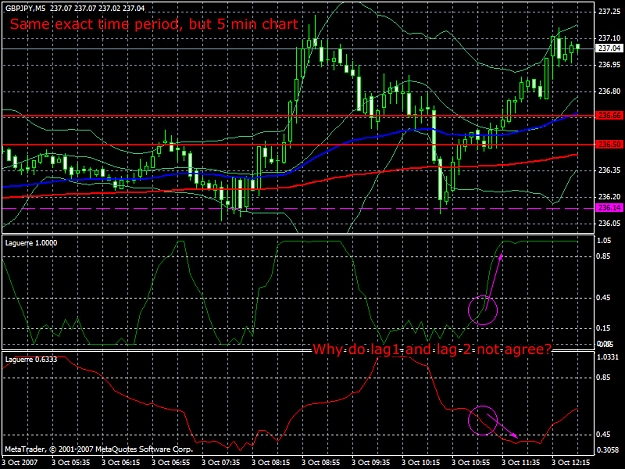
- BFried replied Oct 3, 2007
One last question...sorry! On this chart from yesterday, what are the red solid horizontal lines and the purple dashed horizontal line? Also, why where they there yesterday but not today? My one minute chart doesn't have the lines right now, but my ...
Simple Method of Scalping any pair on 5 min chart , specially GBP/JPY - by Imran Sait
- BFried replied Oct 3, 2007
Imran, I'm a long time reader, first time poster. First off, thank you so much for providing all of this information. I've had some really bad luck in the past with other programs, scams, etc, and it was really nice to find forexfactory and see that ...
Simple Method of Scalping any pair on 5 min chart , specially GBP/JPY - by Imran Sait

- Posts by Member Search: 'BFried'