- Search Metals Mine
- 56 Results (1 Thread , 55 Replies )
- AntiCre replied Jan 8, 2024
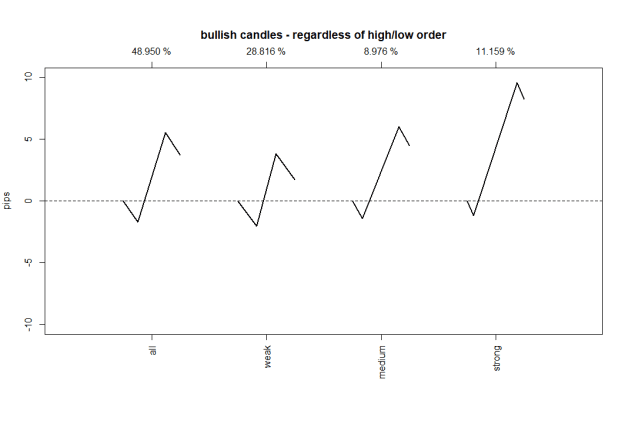
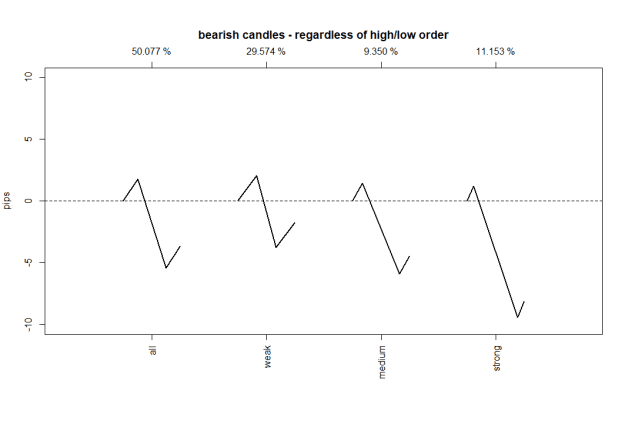
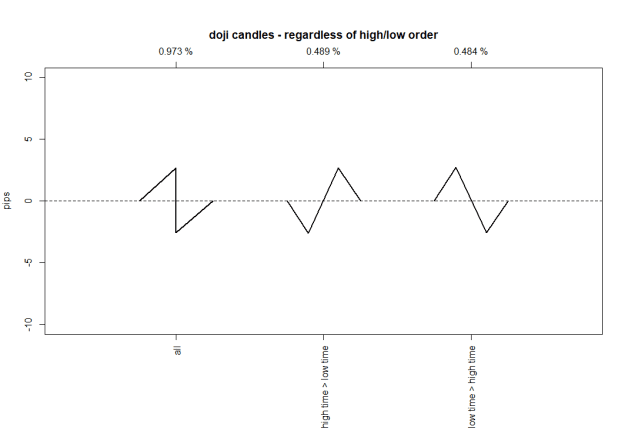
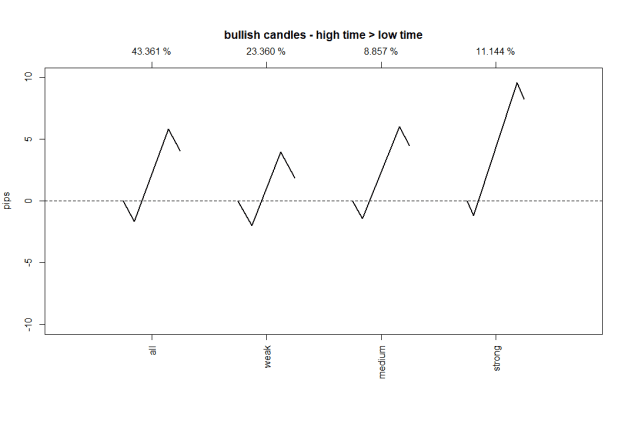
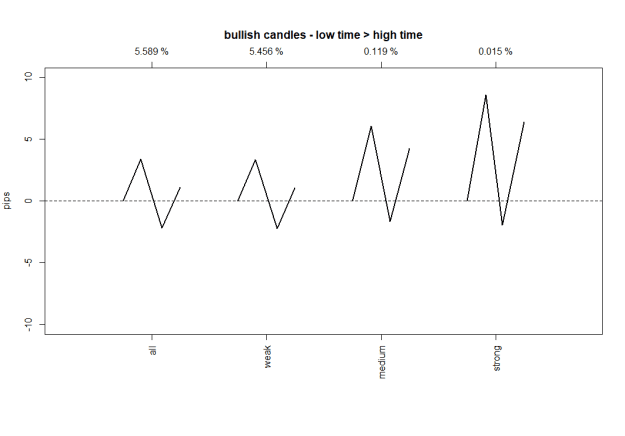
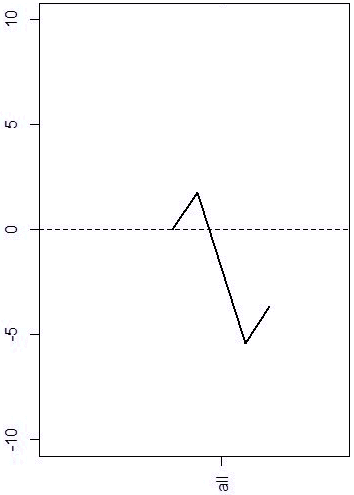
Thanks apprendista, since I know which argument will come next, I'll give something away from what I've done. Only a little for the crowd ... This is what I've done and what I've asked for in post #69. First: How do AVERAGE bullish candlesticks look ...
Questions for real pros: How to trade with reference points only?
- AntiCre replied Jan 6, 2024
That's what I planned to talk about if anybody could get that stats. The idea is not to use past performance to predict next occurences, but to use it to measure where price is right now (in relation to these reference points). Yes, price moves ...
Questions for real pros: How to trade with reference points only?
- AntiCre replied Jul 8, 2023
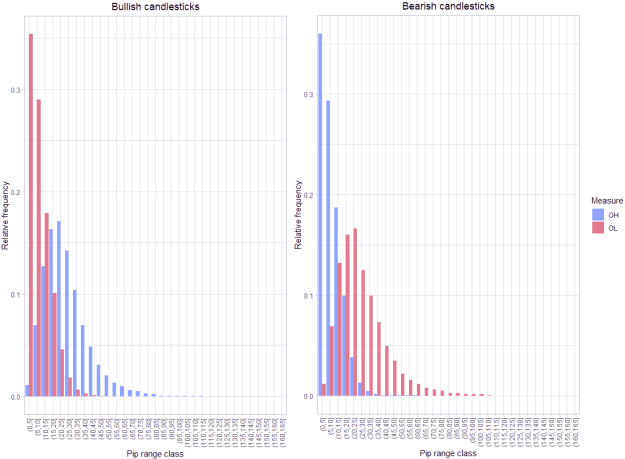
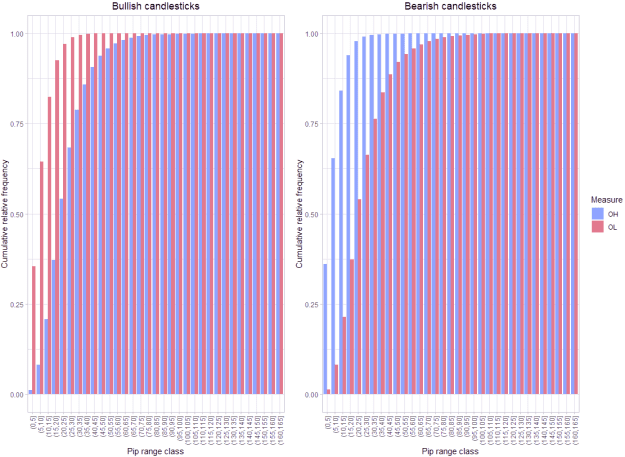
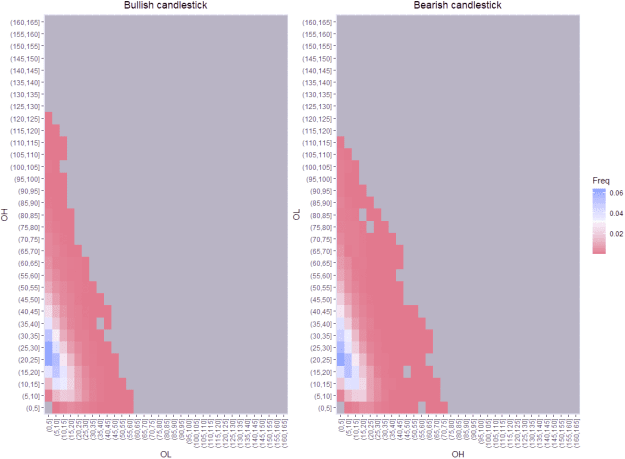
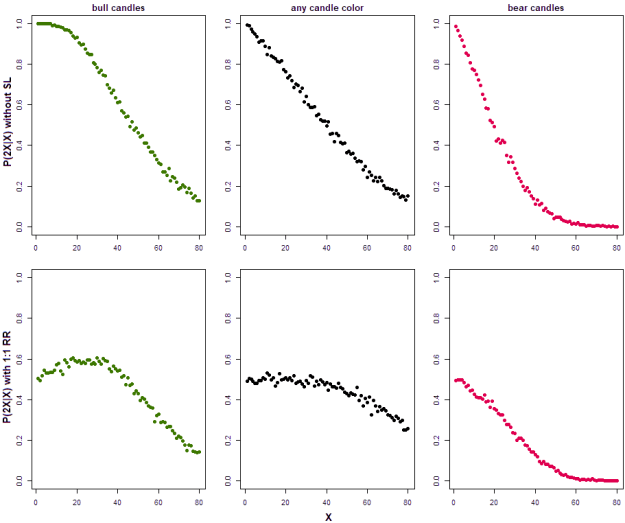
Just a small programming exercise to avoid getting rusty (and to present more beautiful plots than in my last post). And of course to support nunrgguy's statements: First the frequency distributions for OH and OL ranges in bull/bear candles: ...
Trading made simple with added BS
- AntiCre replied Jul 6, 2023
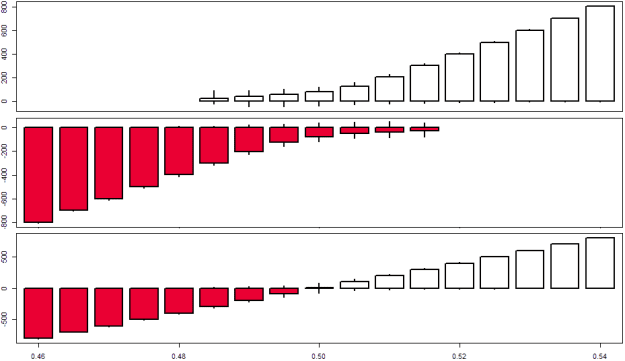
Allow me to complement this. Under the assumption of a random walk market I wanted to know which kind of candlesticks I can expect on average. Thus, I considered a random walk with (-1, +1) increments and generated 10000 candlesticks with 10000 ...
Questions for real pros: How to trade with reference points only?
- AntiCre replied Jul 6, 2023
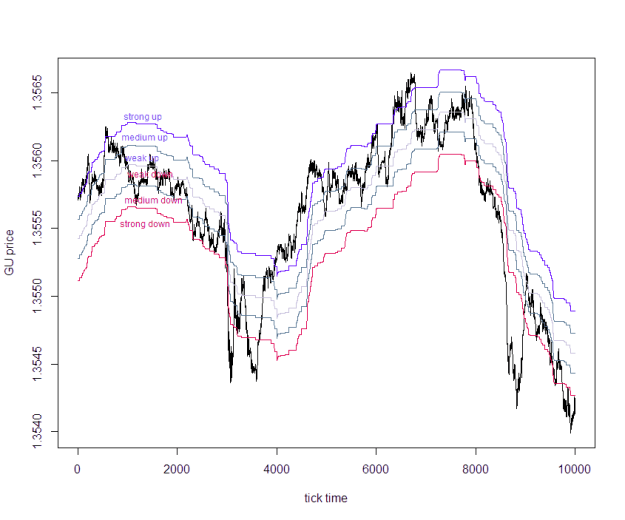
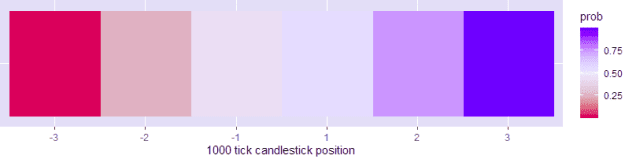
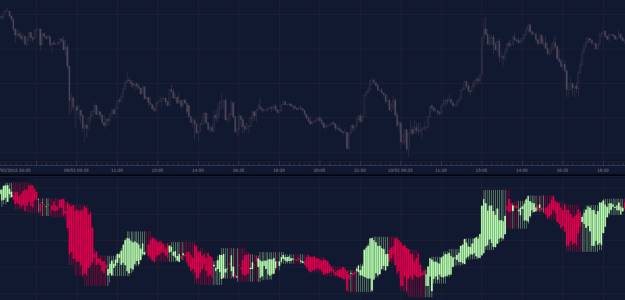
The idea was this: Assume that common TFs are arbitrary cut-off points that cut prices into bars. However, you could create your own candlesticks, e.g. once 1000 ticks (price changes, not neccessarily 1/10 pip) occured. However, you can create these ...
Questions for real pros: How to trade with reference points only?
- AntiCre replied Jul 5, 2023
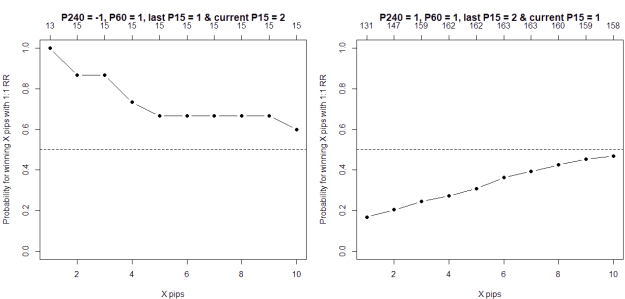
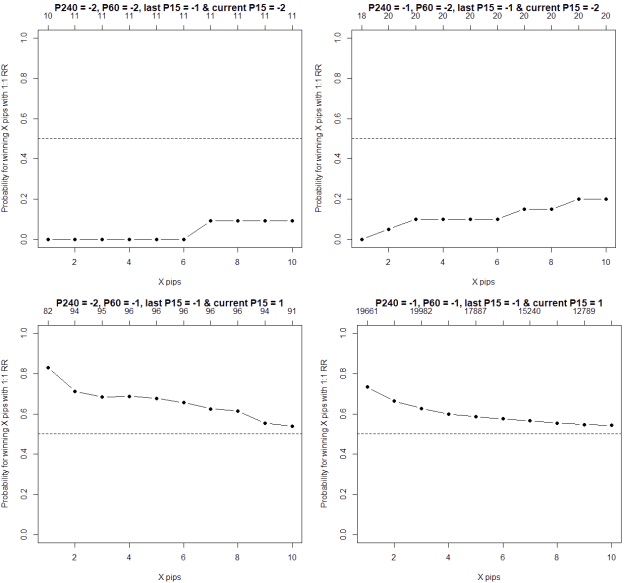
Yes, I somewhat agree. However, I haven't focussed that much on the open. My attempt to investigate the single candlestick in the last days was like this: Compare the current candlestick with the average candlestick. Then, what is the potential if ...
Questions for real pros: How to trade with reference points only?
- AntiCre replied Jun 18, 2023
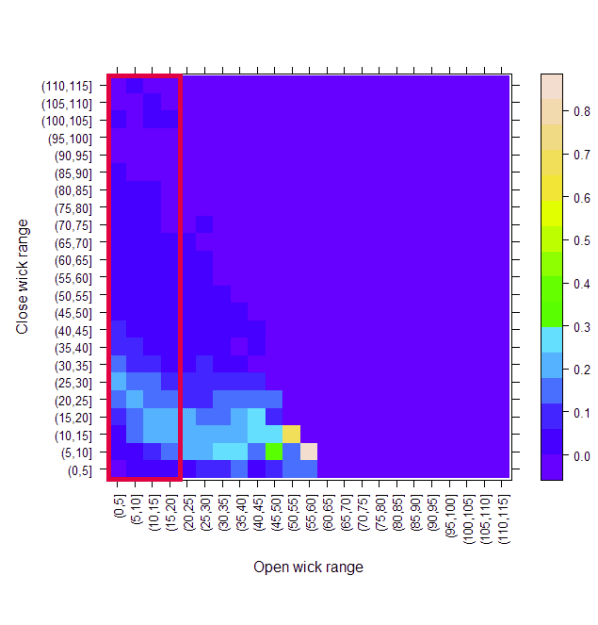
What a pity such nuggets haven't been discussed more ... Another proof of the inefficiency of forums. My take on this. Below is the distribution for close wick ranges, given particular open wick ranges. The red rectangle is imo the region where the ...
Trading made simple with added BS
- AntiCre replied Jun 6, 2023
A good question. And not just "Where have you gone pros?" but also "Where have you gone former FF members that liked to discuss and give opinions with open minds?". It looks like these times are maybe over? It speaks volumes about the FF members ...
Questions for real pros: How to trade with reference points only?
- AntiCre replied Jun 3, 2023
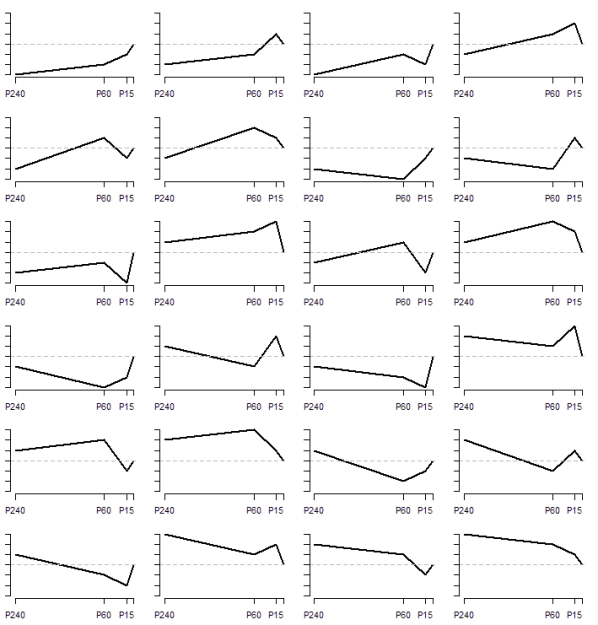
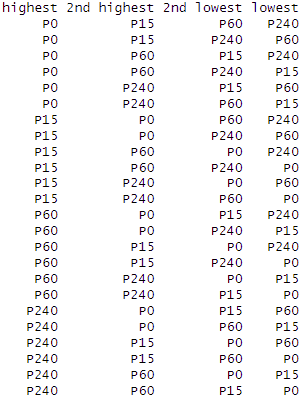
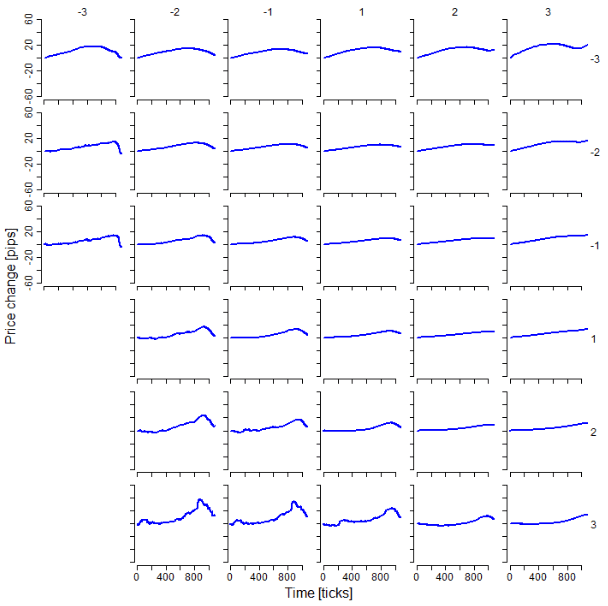
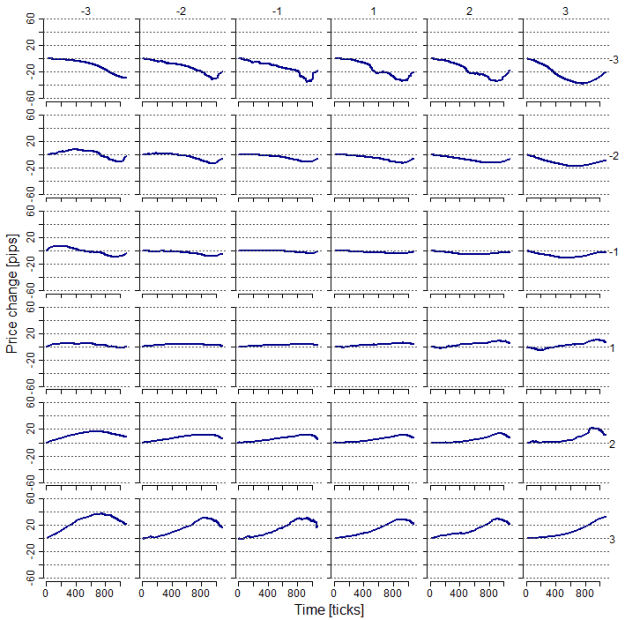
Thank you all for your contributions so far. As previously announced, below I'm posting the imaginable qualitative combinations of 4 price points, P0, P15, P60, and P240. Simultaneously I'm running some stats to see whether some of these ...
Questions for real pros: How to trade with reference points only?
- AntiCre replied May 30, 2023
Hey OT, I couldn't agree more with what you wrote. I won't argue with you. All I'm looking for is a simplication. Wouldn't you have drawn the same conclusions just with these 4 reference lines? Why do you think looking at more data is better? Yes, I ...
Questions for real pros: How to trade with reference points only?
- AntiCre replied May 29, 2023
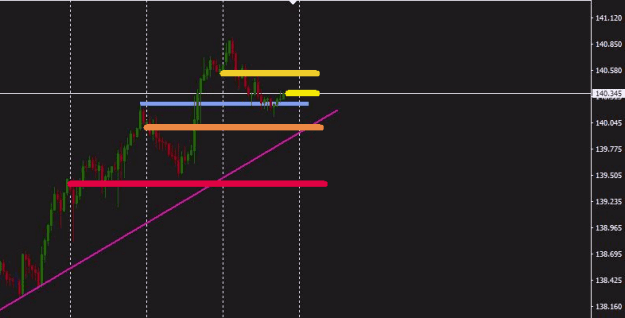
Here's something else to show the lines towards I try thinking. All with the hope to find someone who's willed to discuss my questions from above. Of course I know, that most here will think that I'm completely nuts and that they trade successfully ...
Questions for real pros: How to trade with reference points only?
- AntiCre replied May 28, 2023
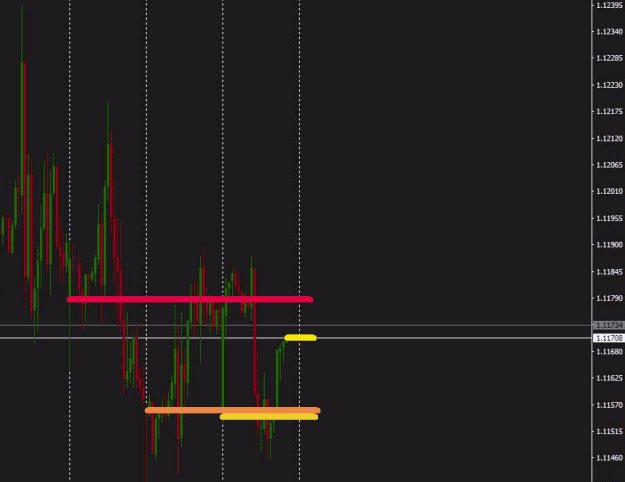
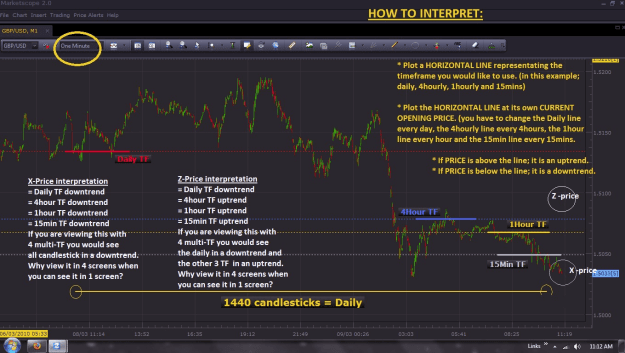
Here I want to start the discussion with some general ideas I had/found on the reference line trading concept: As mentioned in the 1st post, I imagined two ways of trading reference lines so far (of course, you can use any line you want): 1. prices ...
Questions for real pros: How to trade with reference points only?
- AntiCre replied Sep 15, 2022
What if it is as simple as that?! MAs are used to smooth price to see the momentum over a longer range. However, MAs lag and so do indicators derived from it. Thus, it's hard to use this information in RT trading. However, when combining the ...
Higher Edge within a Single Candlestick
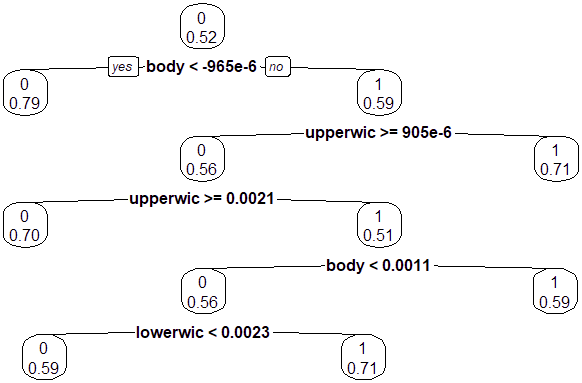
- AntiCre replied Jun 29, 2021
Long time no see, @TracingDelta. I hope you're fine! Looked at your thread again and want to beg your statements with some stats. First, I used a discriminant analysis on principal components (DAPC) to predict if the last candle's high/low has been ...
High/Low Strike
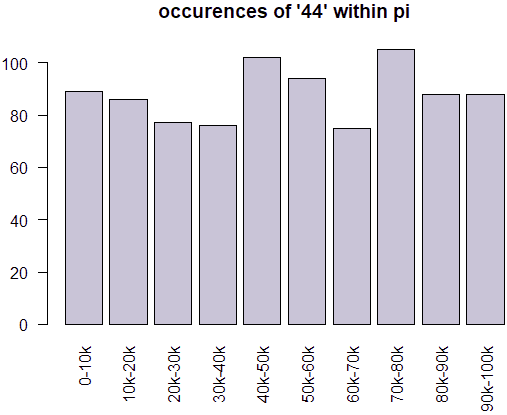
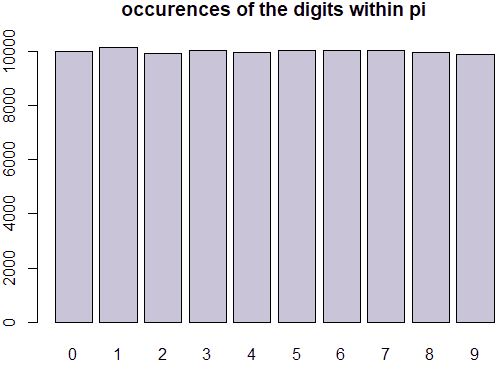
- AntiCre replied Mar 18, 2021
Hi blob, giving some numbers and a very cryptic text won't help. However, since you asked for a data scientist, I used R to look at the frequency distribution of the number 44 that you marked in the first 100k digits of or the number pi. The ...
The hidden numbers of forex
- AntiCre replied Jan 15, 2021
Hi dk, I know, this is a rather old post of yours from the beginning of the thread. However, please allow me to ask/ponder on that statement ... A few years ago I maybe had a similar thought tha you: "What if I'd identify some kind of average, ...
LFX Trading Proverbs
- AntiCre replied Dec 31, 2019
An addendum to the previous post ans some furhter probabilities ... Assume that the first 4 numbers of a sequence of interest (e.g. close prices) doesn't contain an increasing or decreasing subsequence. What is the probability that the last, fifth ...
The similarity system
- AntiCre replied May 28, 2019
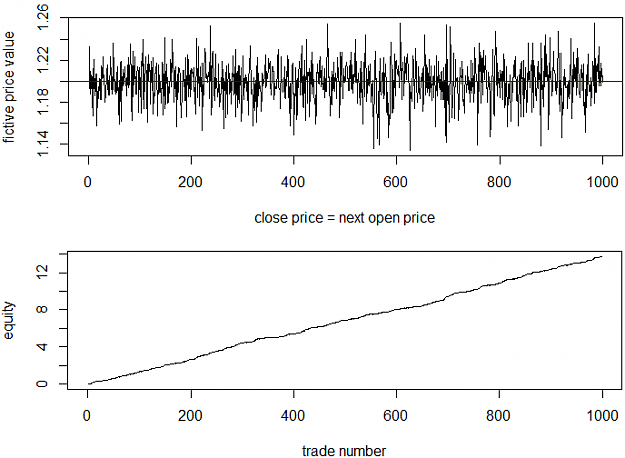
Hi FXEZ, I know this is an older thread and I know that you haven't been active @FF for quite some time - but here you go: It is possible to be successful on random data. However, the data must be stationary and symmetrically distributed around the ...
FXEZ's Quantitative Research In R
- Way to approach the ZigZag indicator! (?)Started Apr 17, 2019|Trading Discussion|73 replies
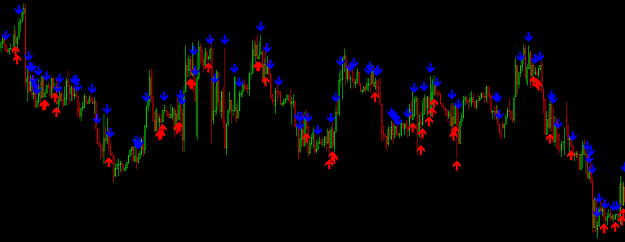
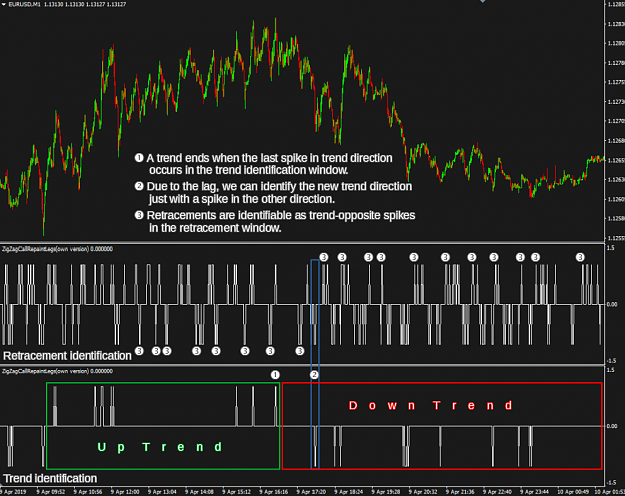
Introduction I think almost all traders know the ZigZag, an indicator that connects tops and ...
- AntiCre replied Apr 4, 2019
Reminds me somehow on a small island on which I lived for a few years a while ago.
Staying In My Lane - A Read-Only Journ(al/ey) image
image