- Search Metals Mine
- 141 Results
-
 8tango replied Sep 1, 2023
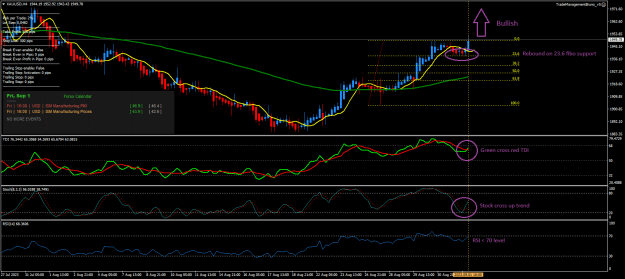
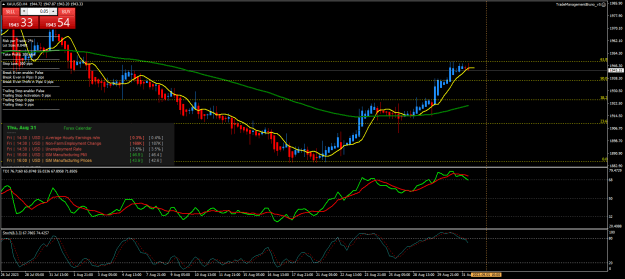
It's bullish in Daily chart and now in H4 chart, Daily up trend continue. H4 chart analyse. image
XAUUSD (GOLD)
- 8tango replied Aug 31, 2023
Surgical precision (in image) of the supports and resistances of the Kijun Sen. image
Gold
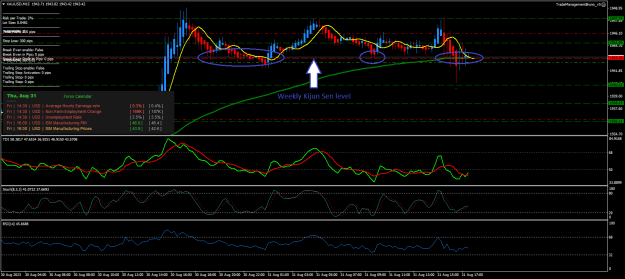
- 8tango replied Aug 31, 2023
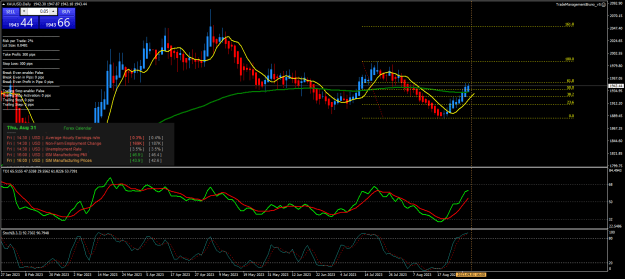
There is a weekly Kinjun Sen support (red dotted line) at 1943.30, if the price break this support ok to open a sell but for the moment this support is solid. There is also MM100 (green line) as support and on the same level (1943.30) than weekly ...
Gold
- 8tango replied Aug 31, 2023
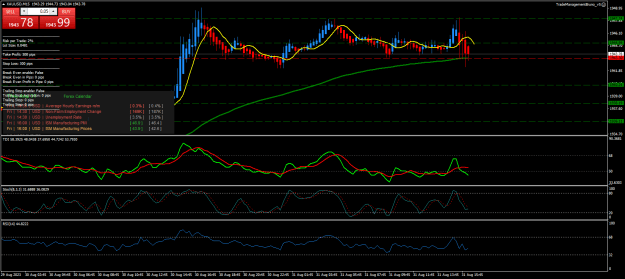
For me on daily chart, Gold is up trend but it touch 61.8 finobacci. image On H4 chart we can see that the price touch many times the 61.8 finobacci level, I suggest a consolidation period before to continue the up trend. image
Gold
- 8tango replied Aug 11, 2023
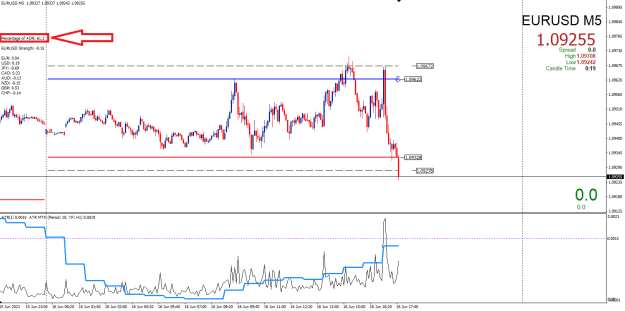
Hi Ronin, Coud you explain the "Percentage of ADR" display on chart? Is there rule to trade or no (depending of the value of this ADR)? image
DHR - Daily Half Range Strategy
- 8tango replied Jun 19, 2023
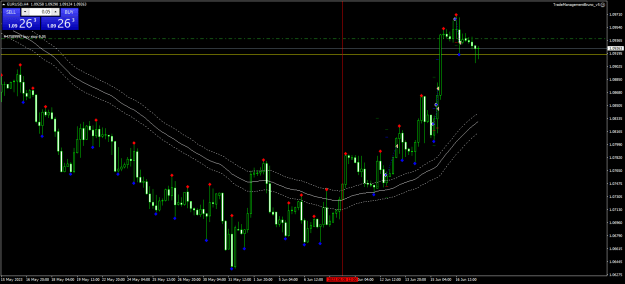
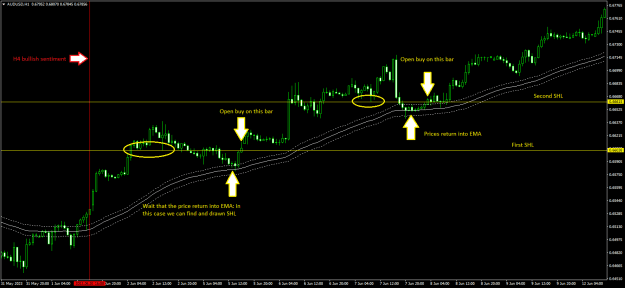
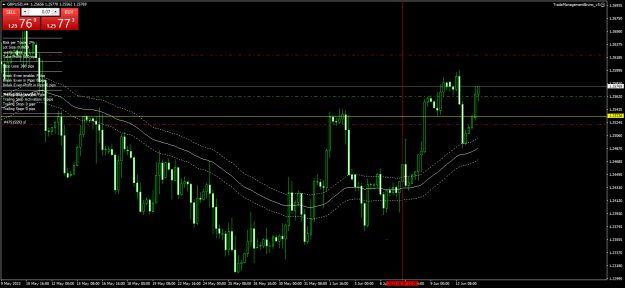
"Whenever the 4Hr candle closes above the EMA wave then we are in a bullish sentiment" => See post #1 Prices closed above the EMA wave the 8 June at 12pm on my chart below and they never closed below EMA since this date. It's always a bullish ...
ISR Method
- 8tango replied Jun 19, 2023
On H4 EURUSD chart, it's always bullish sentiment, you must take only buy order on H1 and/or M15. image
ISR Method

- 8tango replied Jun 15, 2023
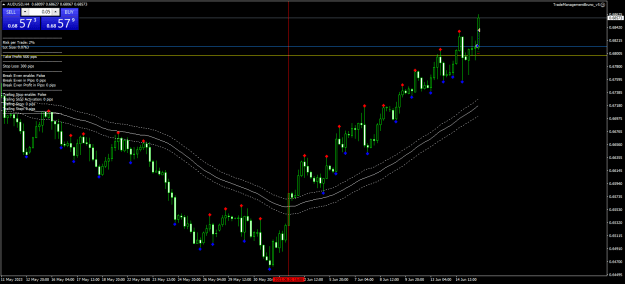
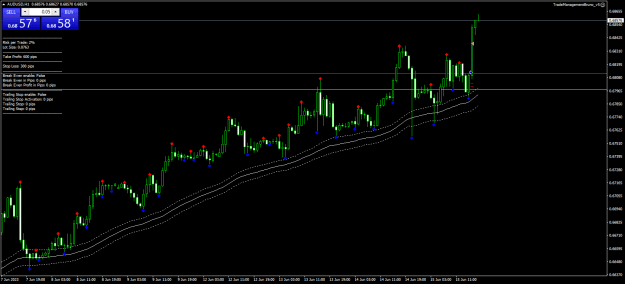
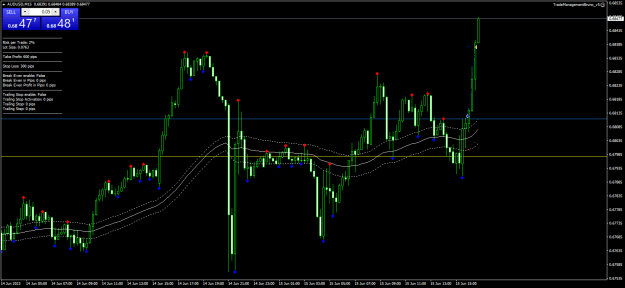
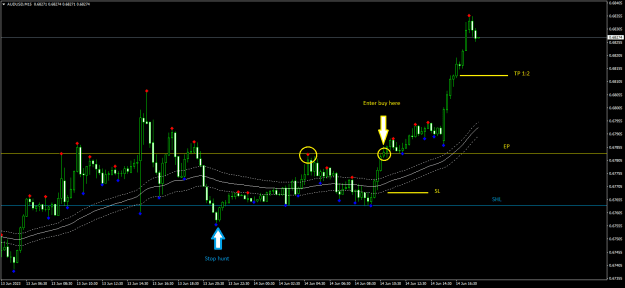
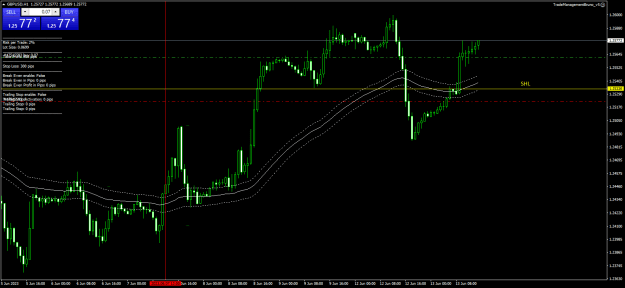
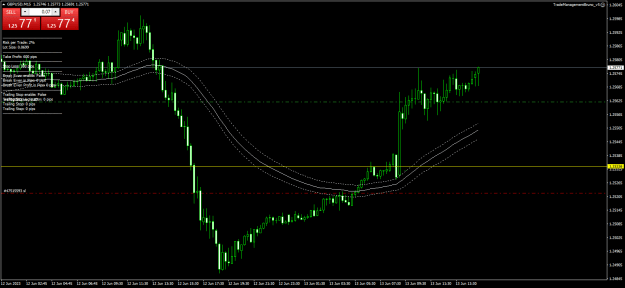
H4 image H1 image M15 image Yellow line is SHL level drawn with H1 chart. I drawn this line with the help of fractals indicator (blue bullet for a buy induction). Blue line is drawn only with M15 chart. I place a buy pending order on blue line ...
ISR Method

- 8tango replied Jun 15, 2023
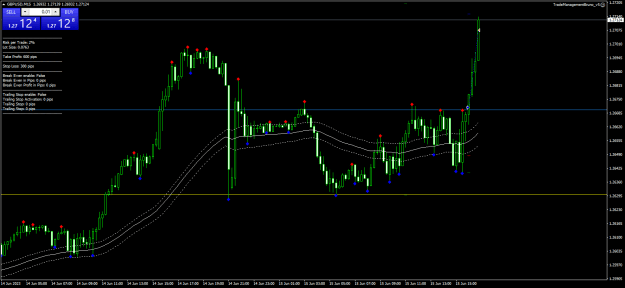
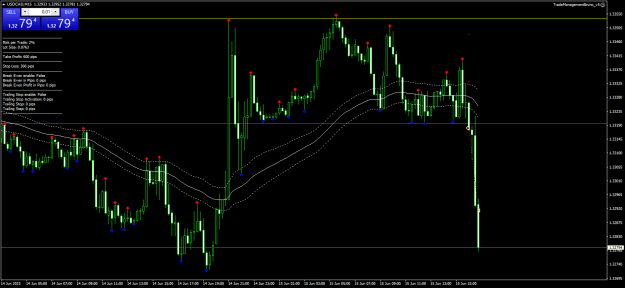
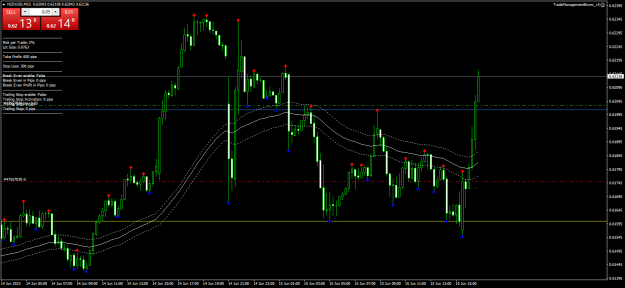
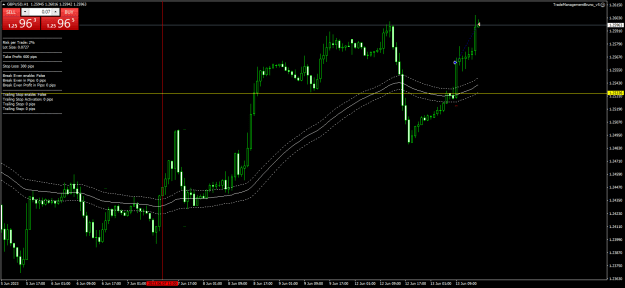
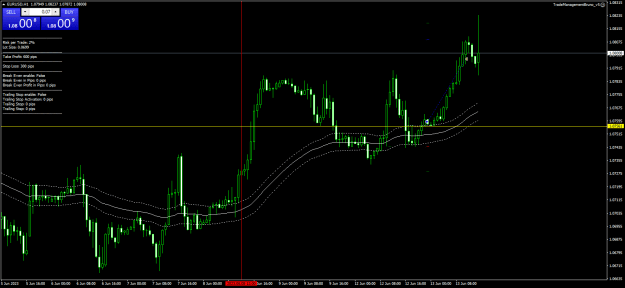
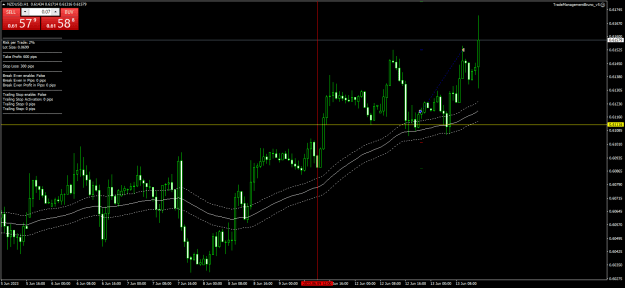
4 trades all closed in profit with TP 1:2 image image image image And one trade still in progress: image
ISR Method
- 8tango replied Jun 14, 2023
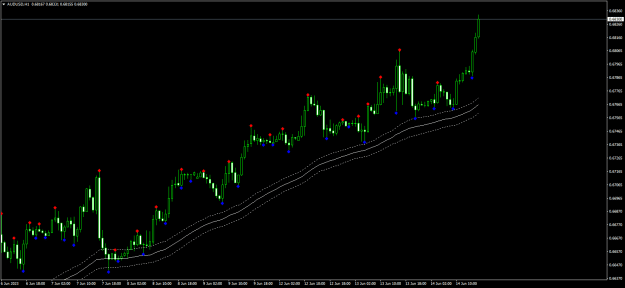
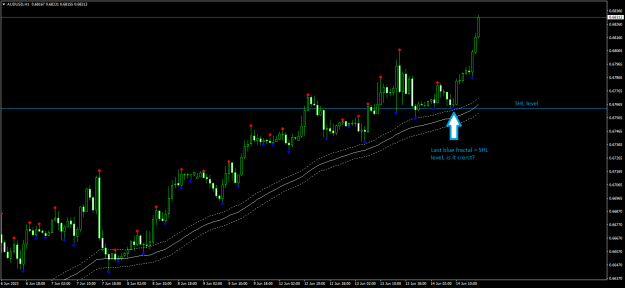
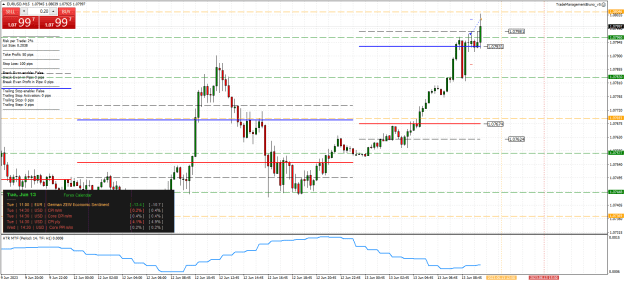
If we use the MT4 fractal indicator to find and place SHL level, is it a good idea or no? image image
ISR Method
- 8tango replied Jun 13, 2023
I don't know if it's a correct method to find SHL level but I think that it's easy method. image
ISR Method
- 8tango replied Jun 13, 2023
And also, this 2 trades below are closed in profit too
ISR Method image image
- 8tango replied Jun 12, 2023
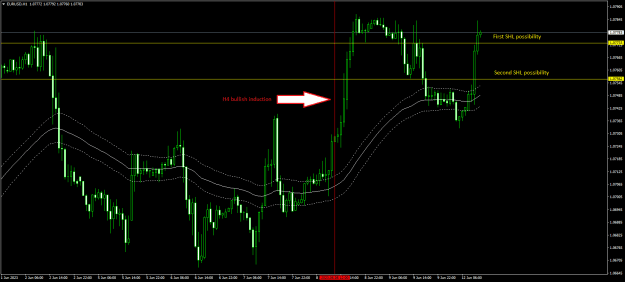
I don't understand where to place the SHL on H1 EURUSD chart, for me there are 2 possibilities, which is the better? image
ISR Method
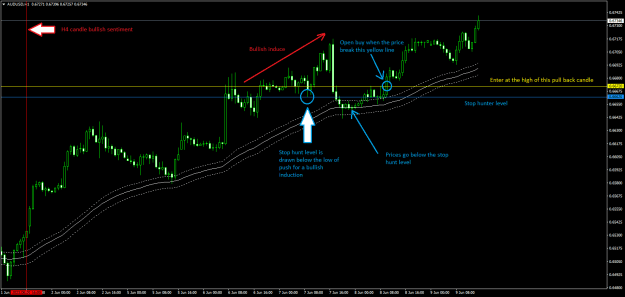
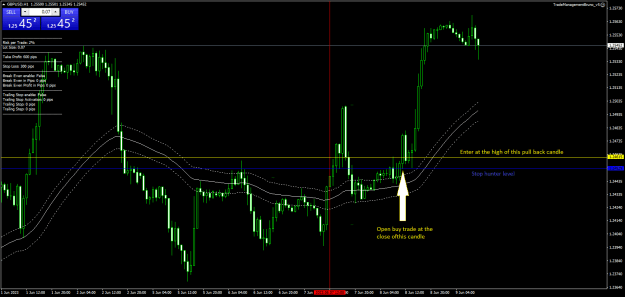
- 8tango replied Jun 9, 2023
Sorry but I don't understand what is wrong with my buy setup below? image On the chart on post #1 it is noted: Entry at high of the pull back candle? But when we must open a trade: at the next close/open candle, when the price break the high of ...
ISR Method