- Search Metals Mine
- 17121712 replied Mar 24, 2011
There was something I wanted to ask also. I have attached a quick 15M snapshot from the two days following the quake. The first spike upwards here was shortly after the earthquake hit. We then see a severe shift to the downside. Is the standard ...
- 17121712 replied Jun 29, 2010
OK. After a day of crazy voltility we are perched on a trendline once again. A break of 38 or there abouts will call into question a move higher in the coming session. I suppose the plan is to make nice entries with stops in that area to look for a ...
- 17121712 replied Jun 28, 2010
I was wondering if I could get a little help dissecting today's trade. I have attached a 5M chart with points A through H. A: 1st entry @ 54.15 stop at 47.5 B: 2nd entry @ 55.86 stop at 51.5 C: The market hit resistance at 59 half an hour before and ...
- 17121712 replied Jun 27, 2010
Here is my hourly chart. Either tomorrow or Tuesday I will be looking for a break of 59. I want a better price than the current 56, I will be looking to take on a position as close to 52 as possible with a stop around 48. The 15 minute chart (not ...
- 17121712 replied Feb 16, 2009
A. Breakout to the upside above short term range and 50 EMA, entry @ 263. B. Bounce near 300 ADX cycle well and truly finished, looking for a retest of local high. C. Got bored of waiting for 293 again, exit @ 286. I also have a strong bearish view ...
- Odds Question
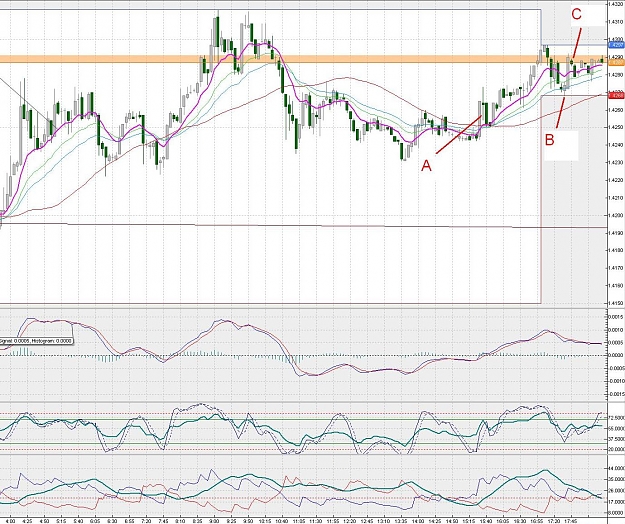
At around 0620 GMT the EURGBP price bounced off the previous day's low of 9047. The day's high was ...
- 17121712 replied Feb 26, 2007
Here's a chart. Notice the two lines intersecting at the high of the candle at 649. Test of 600 before a move higher?
- Posts by Member Search: '17121712'