- Search Metals Mine
- 13 Results
- niubee replied Jan 8, 2017
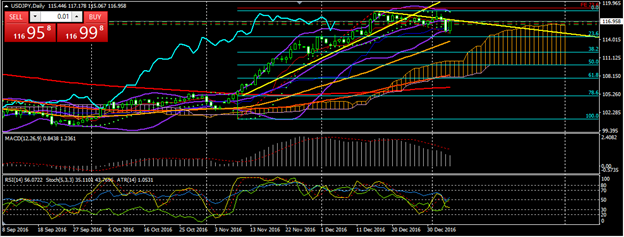
Hi bro, Sorry I'm late to give you the screenshots. Now I'm free, so I'm gonna give you more detail explanation why I took long position. Indicators I use: Bollinger Bands Ichimoku RSI MACD Stochastic SMA 50,100,200 SAR Fibonnaci (retracement and ...
USD/JPY Discussion
- niubee replied Jan 3, 2017
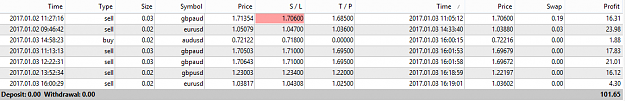
I'm quite happy today, got new record. Some manually closed because I panic see the price goes different direction suddenly even almost all hit the target
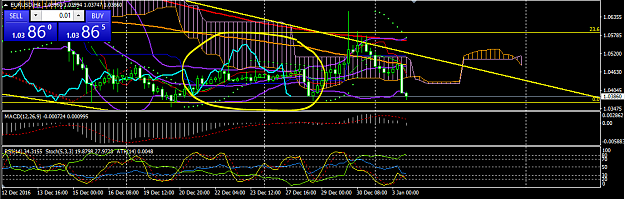
EURUSD New year, new record. Good luck to you all in this new year. Wait for NFP
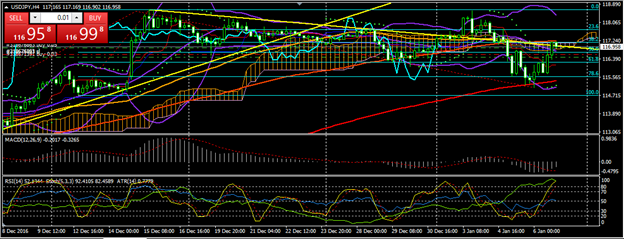
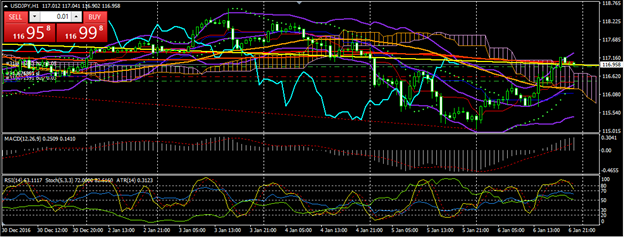
- niubee replied Jan 3, 2017
Well, I have to close it manually before "ISM Manufacturing PMI". Have reach bottom of head and shoulder. Wait for the news
EURUSD
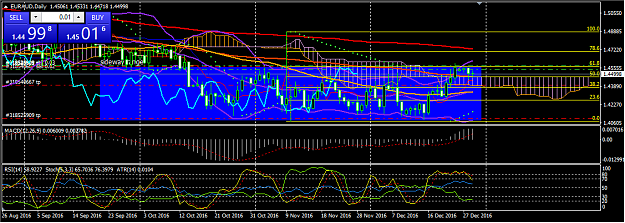
- niubee replied Dec 29, 2016
I saw sideways on daily chart. I have opened short since price @1.4575. It's been 6 days and still hard to break 1.4470 (50 fibo). If it can break and close below 1.4470, then it will continue to south
EUR/AUD

- niubee replied Dec 20, 2016
Hope we can get there
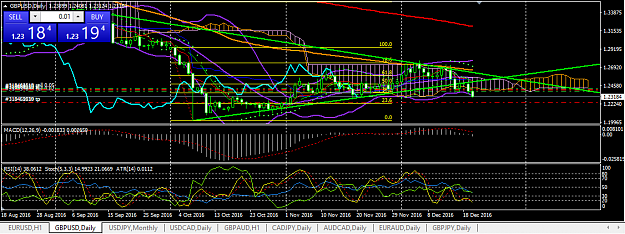
Cable Update (GBPUSD) My reason is like below chart (sorry really mess  ) I use D1 chart. 1. Below middle BB 2. Below 100 SMA 3. Below trend line 4. Below SAR 5. Below Kijun and Tenkan, Chikou span cross from ...
- niubee replied Nov 3, 2016
The movement really slow or it just my feeling? USD pairs look annoying, I'm watching EU, GU, UJ the movement so slow.
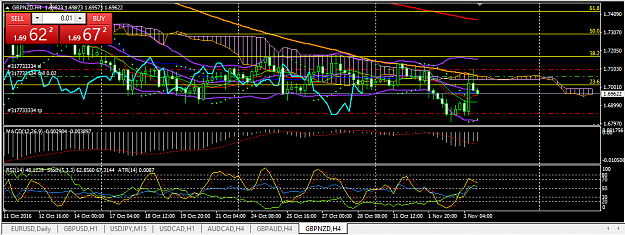
Cable Update (GBPUSD) So I switch to GBP/NZD, not bad down 70 pips
  RSI below 50.
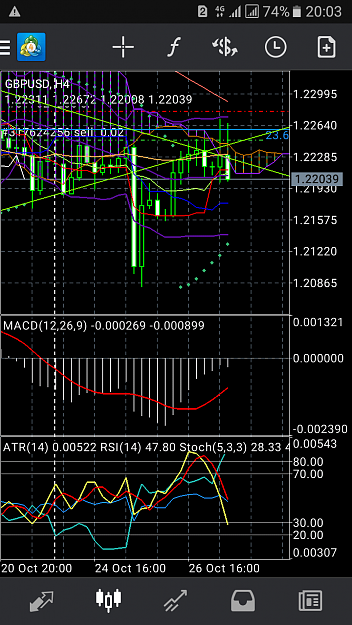
- niubee replied Oct 27, 2016
ÂÂÂ Not sure Sam. It still below trendline, RSI and stoch going below 50 on 4H chart. Already short @1.2247, 1 minute after news. The weird thing sometimes price going down even bad news. ÂÂ Lock small profit. ÂÂÂ ÂÂÂ
Cable Update (GBPUSD)
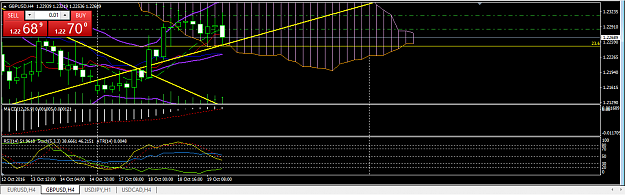
- niubee replied Oct 19, 2016
From D1 chart, RSI still under 50. From H4 chart, price still above the trend line. But if it break and close below 1.2250, maybe it will start to going down again. The RSI is going down to 50, so does the Stochastic. From H1 chart, RSI and ...
Cable Update (GBPUSD)
- niubee replied Jun 23, 2016
Enough for today... almost hit TP but turn up again... close manually. I'll step aside.
Cable Update (GBPUSD)
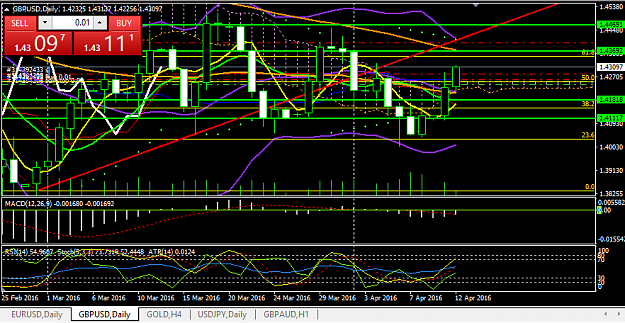
- niubee replied Apr 12, 2016
from my daily chart 100 SMA @1.4374 Horizontal line @1.4369 Upper boll @1.4415 Trendline @1.4415 My current [email protected] Price @1.4380 would also great. I have set trailing stop 20 pips, so I don't mind if the price hit my SL
Cable Update (GBPUSD) Good luck to you. Great ...
- niubee replied Apr 2, 2016
Sometimes I feel frustrating when the price hit my SL even I have placed a correct target. I have a bad luck on placing entry
Cable Update (GBPUSD) It happen several times


- niubee replied Feb 22, 2016
How low can it goes?? This is crazy... almost 600 pips and still going down
Cable Update (GBPUSD)

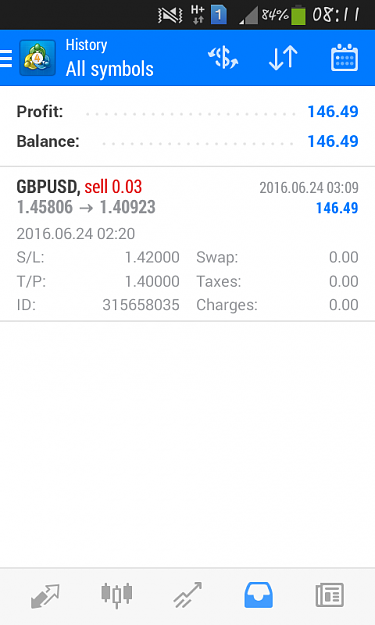
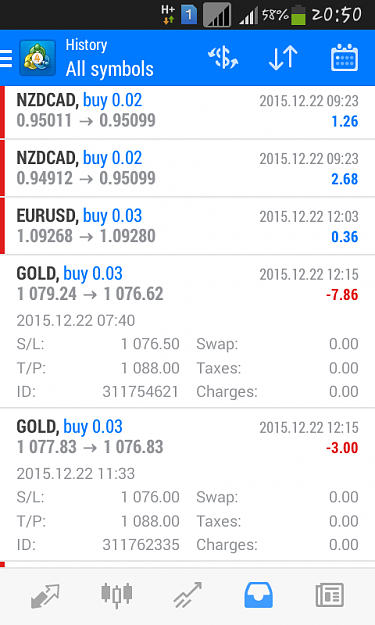
- niubee replied Dec 22, 2015
Arggghhhh... unlucky me
EURUSD Few hours after I close, the price bounce up to 1080 (because I'm panic I will loose more). Got some pips when the price goes down.
- Posts by Member Search: 'niubee'