- Search Metals Mine
- 6 Results
- miho replied Feb 22, 2016
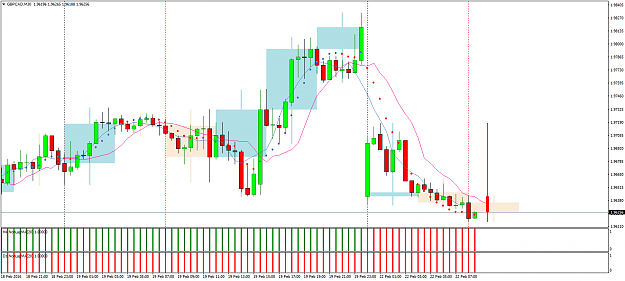
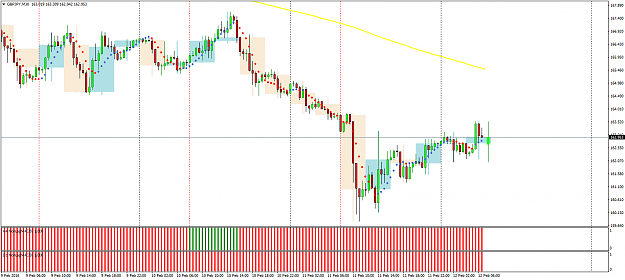
No, I don't think -2...If you put -2 you have a wrong data, see the picture blue sma is 7 and -2 like you say and all is incorrect but the pink sma is 8 and shift 2 and it is perfect, when the candle is closed under 8 sma you have the red dot on ...
trend catching with NonLagDot indicator
- miho replied Feb 11, 2016
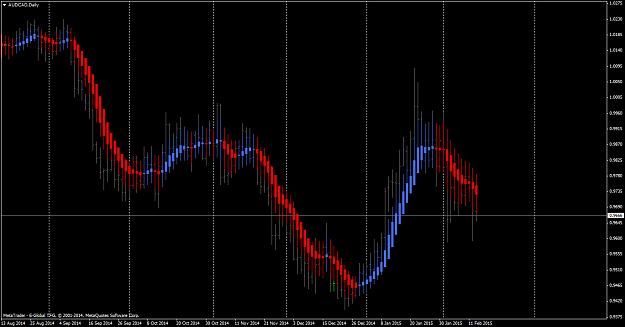
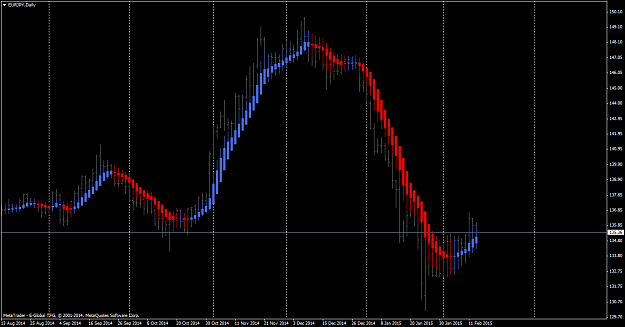
I have this nice indicator when you insert it in current time frame you can choose to see candles from bigger time frame, maybe some of you will find this useful
trend catching with NonLagDot indicator Cheers
- miho replied Feb 14, 2015
Hi, Nice thread I started this strategy live two months ago with 27 pairs normal haiken ashi and I trade manually because I do not have an EA and my broker doesn't have a meta trader it is JAVA platform. My question is: as we can see you are on ...
HA_Rider (A Robots Lab EA)
- miho replied Jul 28, 2014
Hi, I am in forex since 2007, I've been trading several strategies but last two years naked chart only. This strategy is excellent, one of the best I've ever seen, this what I am worried about is backtesting, can you tell me how it can be relevant ...
Eitan's Project
- miho replied Jul 26, 2014
Hi, I am in forex since 2007, I've been trading several strategies but last two years naked chart only. This strategy is excellent, one of the best I've ever seen, this what I am worried about is backtesting, can you tell me how it can be relevant ...
Eitan's Project

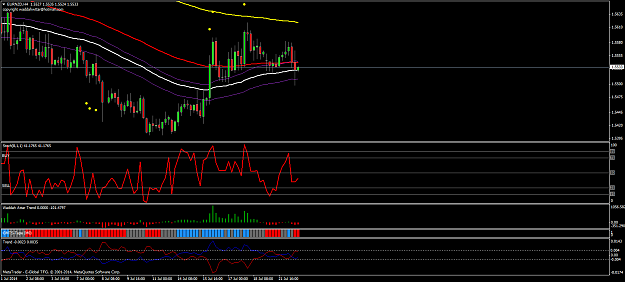
- miho replied Jul 22, 2014
Hi, My broker is different gmt than yours, new candle H4 just started 10 min ago, but does not matter, you will see almost everything different on the picture...but what I am worried is Stoch, one hour ago it was under level 20 but now it looks like ...
Eitan's Project

- Posts by Member Search: 'miho'