- Search Metals Mine
- 56 Results
-
 landax replied Mar 12, 2019
I am aware that I still need experience, it was just one of my feelings about the difficulty of trading M5. I know the posts, they are all recording on my computers with many examples to illustrate them and read them over and over again. image ...
Strat's PASR Long Term, Stress Free Trading
- landax replied Mar 12, 2019
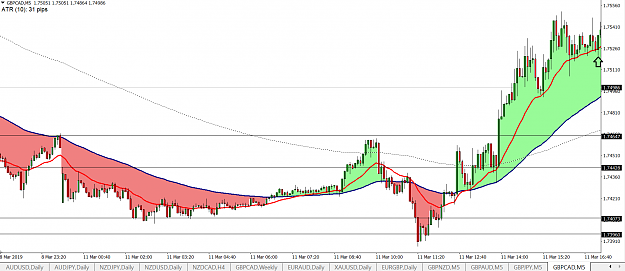
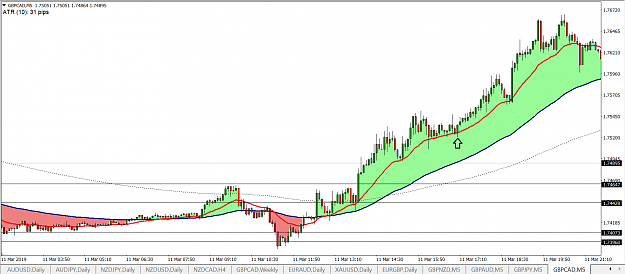
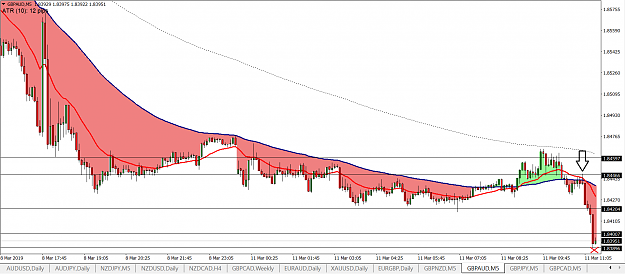
I wanted to share with you, a psychological fact of MT4 that acts on me: I will show you the M5 trend, yesterday on GBPCAD, which was passing, a trend in saw tooth. On the first photo, we have an entry point with this bueb to the Stratshadow. In ...
Strat's PASR Long Term, Stress Free Trading
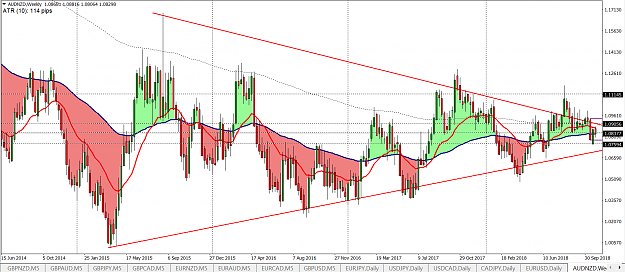
- landax replied Mar 11, 2019
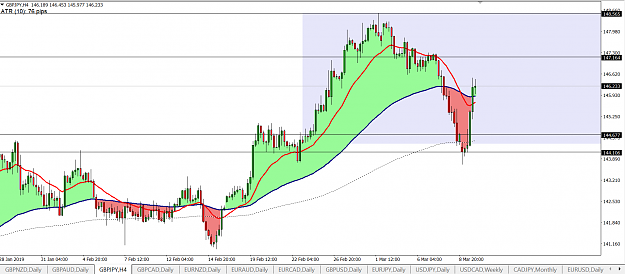
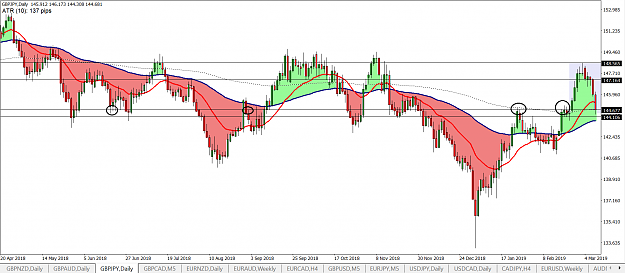
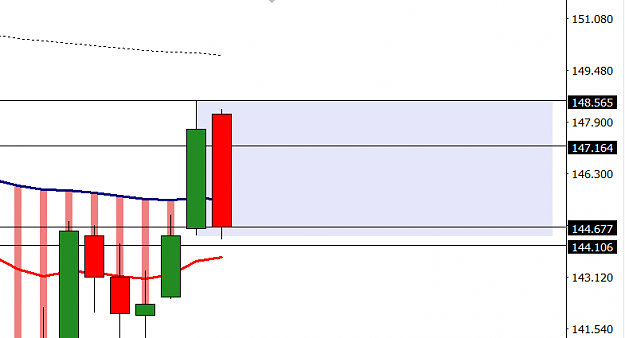
I’m just updating this chart to highlight the hammer/doji that was installed on the 144.106 bracket that I had previously traced. image I did not enter this trade because I was not present but if I had to do so my plan would have been to put a buy ...
Strat's PASR Long Term, Stress Free Trading
- landax replied Mar 11, 2019
Loser image I'm re-entering, after the shooting star and I got stopped. Do you think my add was bad?
Strat's PASR Long Term, Stress Free Trading
- landax replied Mar 11, 2019
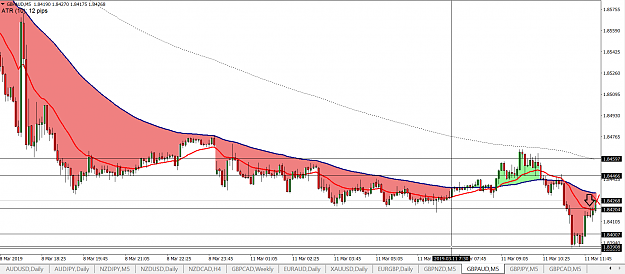
GPB/AUD M5 image I just took this exchange, right after the stratshadow shooting star, I probably closed too early, but I wanted to protect this performance that’s decent. The risk was low relative to rewards. This is what is appreciable with M5, ...
Strat's PASR Long Term, Stress Free Trading
- landax replied Mar 10, 2019
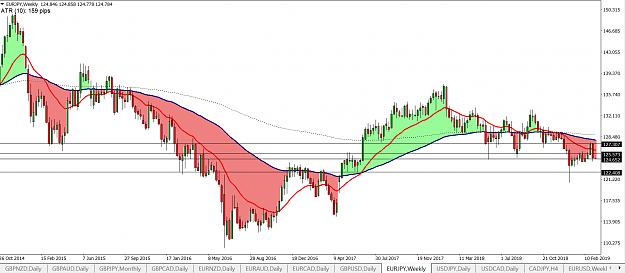
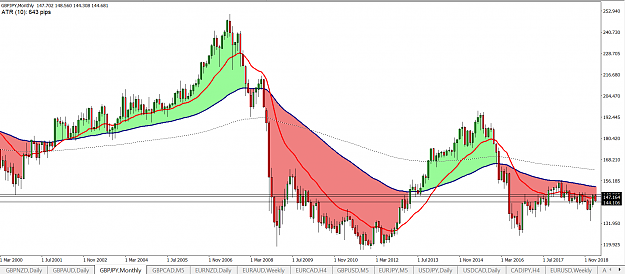
EURJPY bb: Downside trend for 1 years. The January candle was a very nice hammer, it hasn’t failed yet because the price hasn’t closed below its lowest. image b: The buyers failed at resistance 127.300, there were many sellers there, who created a ...
Strat's PASR Long Term, Stress Free Trading
- landax replied Mar 10, 2019
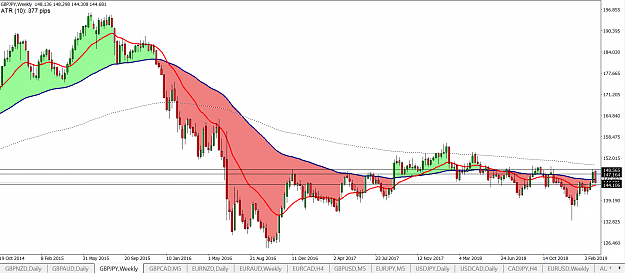
Hi traders Friends, I hope you had a good weekend, here is one of my analyses : GBPJPY BB: Is in a downward trend since January 2018. Price rejected resistance 148,500 five times in seven months. image B: Swing high is underway but not confirmed. ...
Strat's PASR Long Term, Stress Free Trading
- landax replied Feb 25, 2019
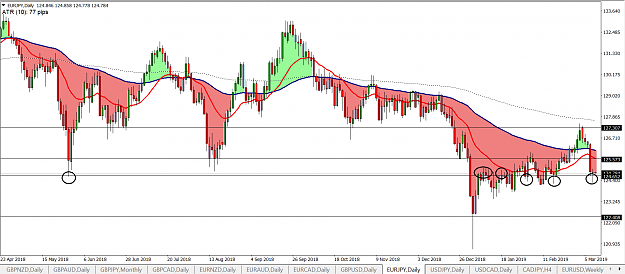
When you start to see this kind of triple bottom, it's largely time to go out because sellers lose control over buyers. I'm not in it, just an observation. image Good trade at all
Strat's PASR Long Term, Stress Free Trading
- landax replied Nov 6, 2018
I will write just one last message tonight because I just want to try to clarify this story of WCC that I do not fully understand otherwise I will not sleep. I really read everything I could on it. Here's how I interpret candles : image On this ...
Strat's PASR Long Term, Stress Free Trading

- landax replied Nov 6, 2018
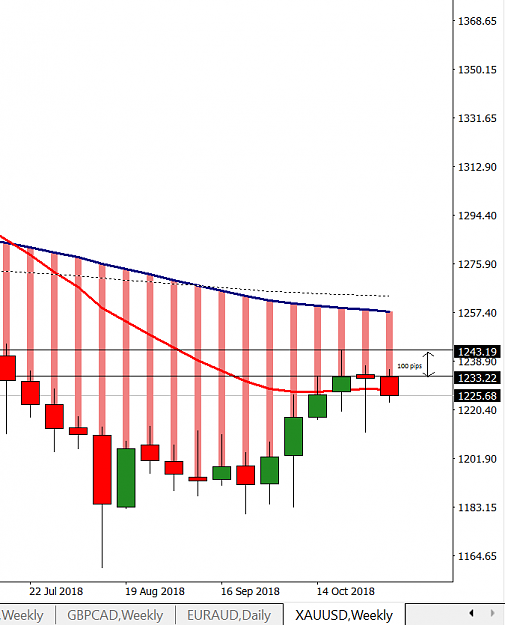
Hello Strat, I could not send you a message in private so I'll do it here but it's about my broker, on my graph I have 100 pips between the maximum and the fermuture of your candle WCC. image I don't want my broker to cheat on my analysis, so I ...
Strat's PASR Long Term, Stress Free Trading
- landax replied Nov 6, 2018
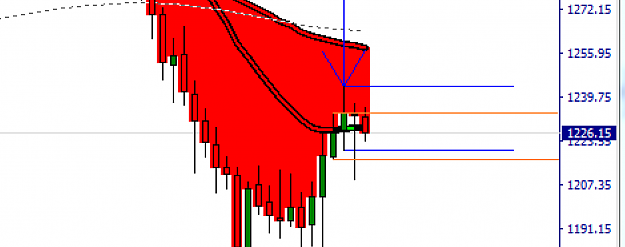
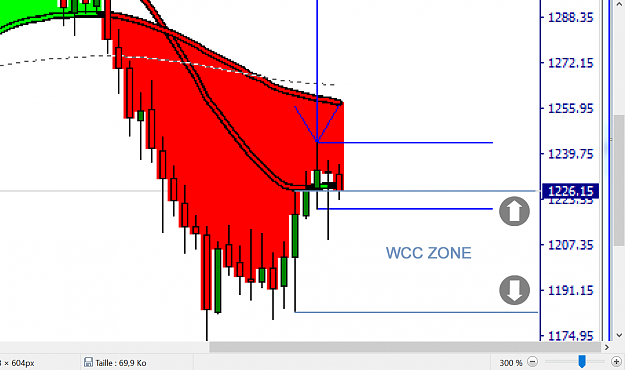
Hello, Fxentropy already welcome to this thread, I try to analyze your graph and so here is: Big Boss: I have defined the nearest support and resistance levels in the BRN range 1.47 to 1.8750 image Boss: The price is stuck in a WCC for 3 weeks now ...
Strat's PASR Long Term, Stress Free Trading

- landax replied Nov 5, 2018
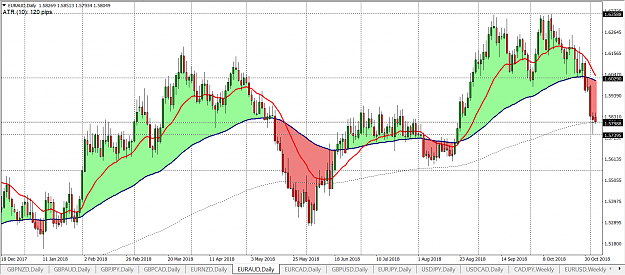
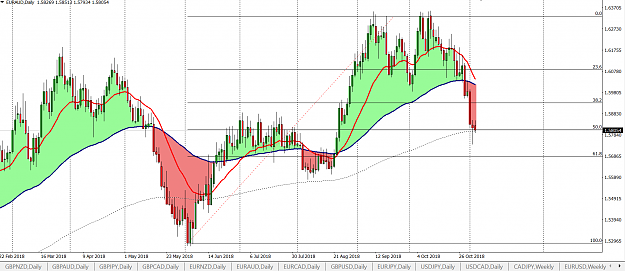
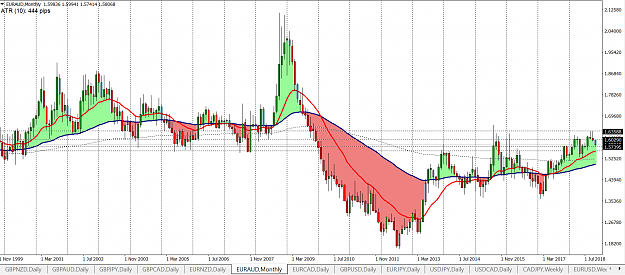
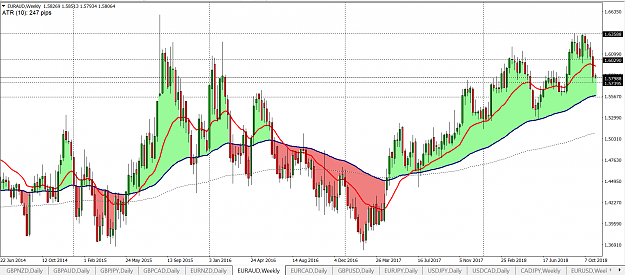
EURAUD Bigboss: Upward trend, we can see that since June the bigboy were intended BRN 1.63500 who was reached late September and late October and resulted in down which is so their profit taking. Price is now at 1.58 support image Boss: Bullish ...
Strat's PASR Long Term, Stress Free Trading
- landax replied Nov 2, 2018
Thanks for your reply, this allowed me to review these candles in the old thread and yes I will pass in real for the experience and the moving hard right edge! image
Strat's PASR Long Term, Stress Free Trading
- landax replied Nov 2, 2018
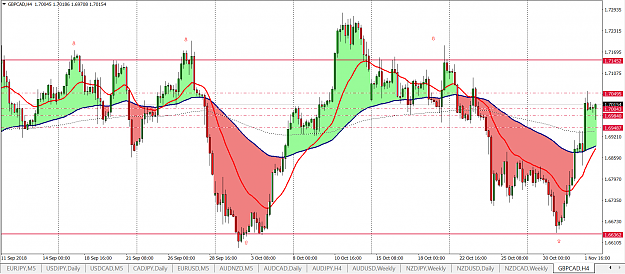
Paper Trade in Live Still on GBP/CAD, BB (daily): Buyers are present, big bullish candle yesterday, which closed just above the Stratshadow but not much image B (H4): The price is currently supported by a resistance by forming a hammer, but it is ...
Strat's PASR Long Term, Stress Free Trading
- landax replied Nov 1, 2018
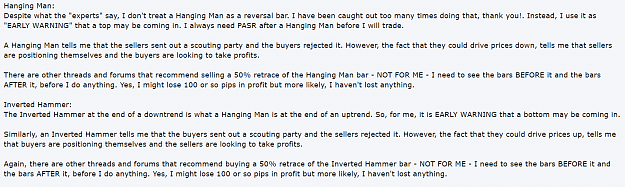
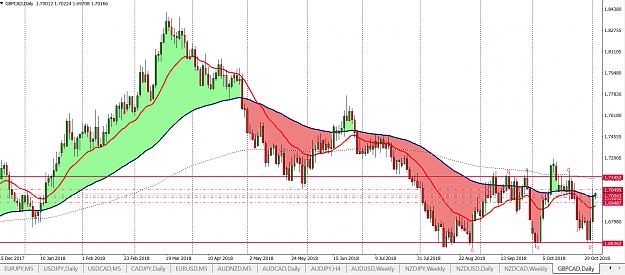
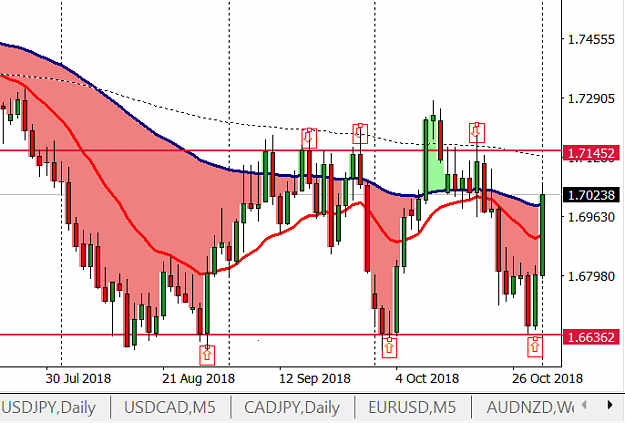
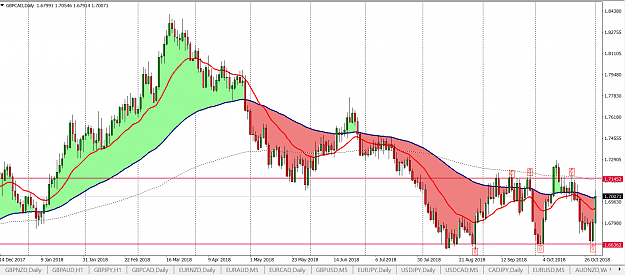
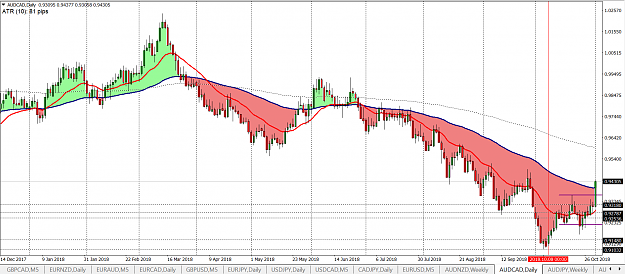
Hi everyone I just analyzed GBPCAD and it is interesting to see on the daily graph, the range in which the price is negotiated between 1.71 and 1.66 each time price stops at the support or resistance I put a little arrow See Photo: image image ...
Strat's PASR Long Term, Stress Free Trading
- landax replied Nov 1, 2018
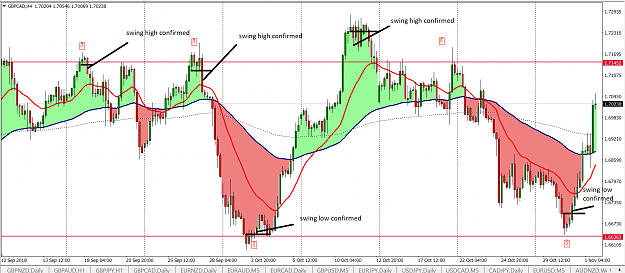
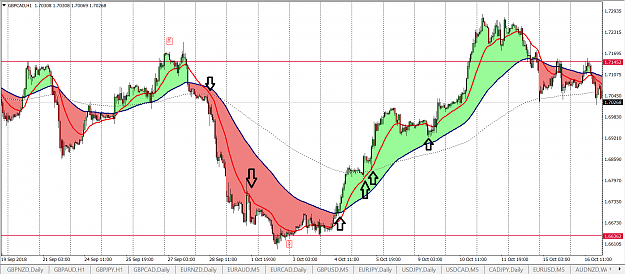
Good evening Strat I have a question about your answer to HappyTrend, On my chart, when you take your entry, the swing low is not yet confirmed on the boss image image So if I understand you're taking this entry with your trading style and risk ...
Strat's PASR Long Term, Stress Free Trading
- landax replied Nov 1, 2018
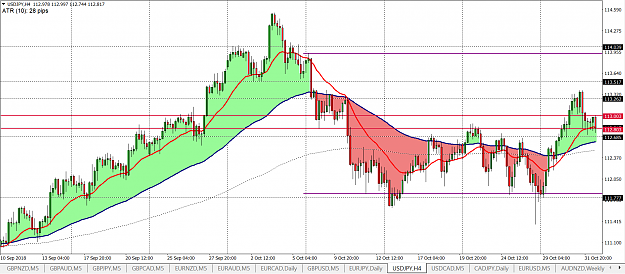
USD/JPY H4 I see that price is stuck in a range of 20 pips since last night Many wicks under the last five candles which means that buyers are close to buying at this level there, there is some buying pressure but however 113 BRN resistance is close ...
Strat's PASR Long Term, Stress Free Trading
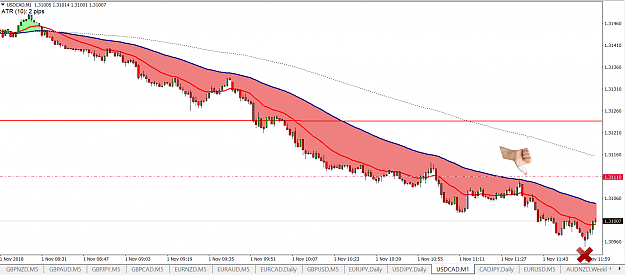
- landax replied Nov 1, 2018
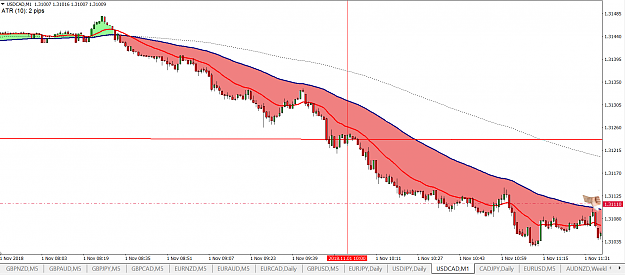
USD CAD M1 Bootcamp Beautiful bearish trend on USDCAD in M1, 10 pips in 20 minutes to train and maintain my brain at the PASR Before : image After : image
Strat's PASR Long Term, Stress Free Trading
- landax replied Oct 30, 2018
Hi Huatzhi, The analysis you made is good but be careful I see a WCC that controls the candles Look at my card: image image
Strat's PASR Long Term, Stress Free Trading
- landax replied Oct 30, 2018
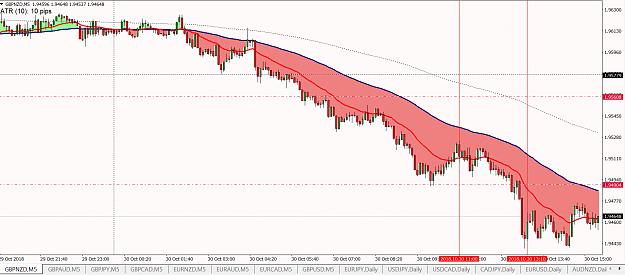
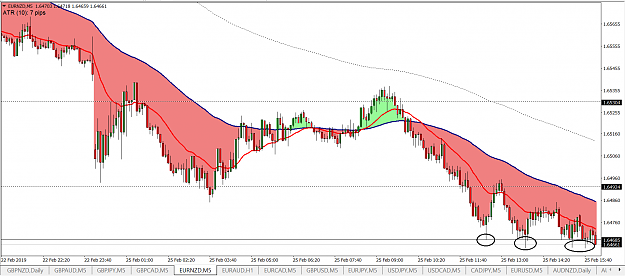
60 pips for me on GBNZD M5, my entry is the first vertical bar, an hour after the opening of London, and my went out to the second vertical bar after the hammer image Simple and effective, the trend was present I entered when it leaped to the eyes ...
Strat's PASR Long Term, Stress Free Trading