- Search Metals Mine
- 81 Results
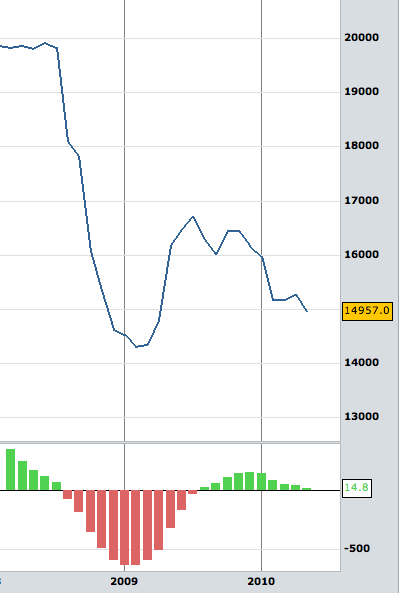
-
 jsspmk replied Oct 27, 2010
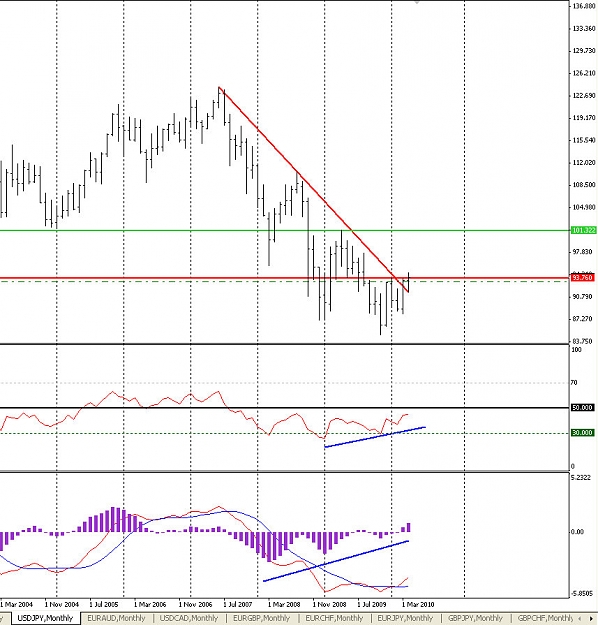
1st target 90 zone - very likely 2nd target 100 zone - likelihood not clear at this stage
USD/JPY Discussion
- jsspmk replied Oct 27, 2010
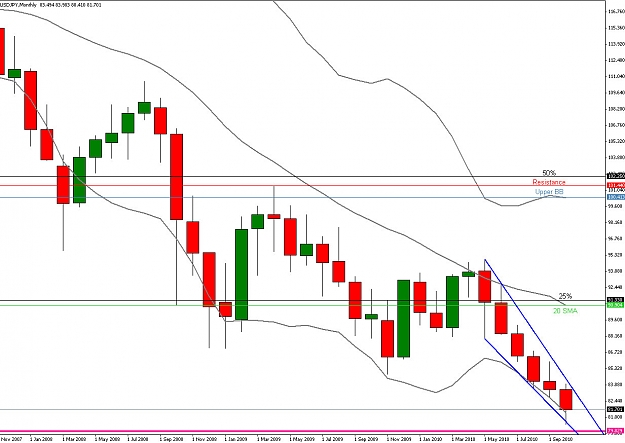
Daily 20 SMA reached (midpoint between BBs). EDIT: Similar p/a to E/U bottom ie support tested few times----support breaks----a quick flush----flush is bought. Now traders have to figure out for themselves what is the probability of a reasonable ...
USD/JPY Discussion
- jsspmk replied Oct 26, 2010
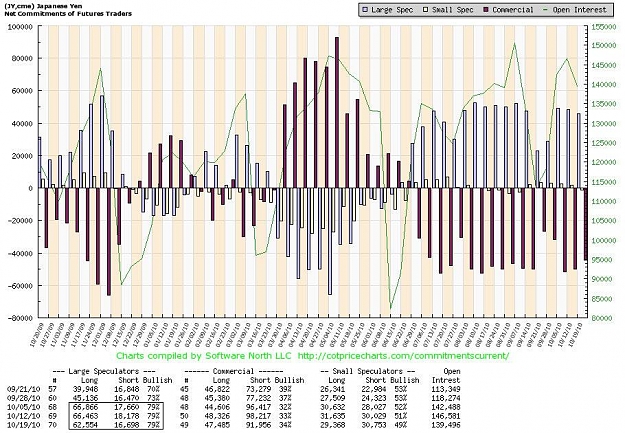
Here is the COT for last few weeks & last 52 week graph. Pretty clear that vast majority of traders remain bullish on Yen (79% bullish) & there are x3.7 more shorts at present. IMO that is out of whack. That is why Japan ain't happy, they say Yen is ...
USD/JPY Discussion
- jsspmk replied Oct 26, 2010
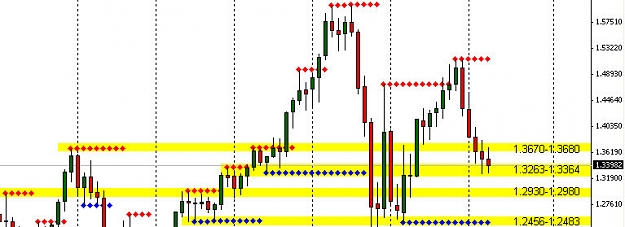
From TA101: In a down trend---Never short near or at support zones.
USD/JPY Discussion
- jsspmk replied Oct 25, 2010
Indeed, non-comms haven't closed enough Yen Longs, in fact it is rather obvious that they can see order flow and "kill it", just switch on something like a 4 hour Ninja chart with MACD, every time it looks like MACD is about to get to the centreline ...
USD/JPY Discussion

- jsspmk replied Oct 19, 2010
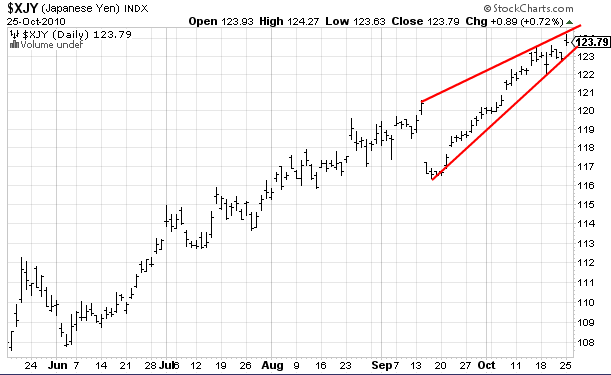
The simplest way to tell when a mid-long term trend in Ninja has changed is on a monthly chart together with 20 SMA. Generally speaking once monthly bar closes above 20 monthly SMA a trader needs to buy dips & when monthly bar closes below 20 ...
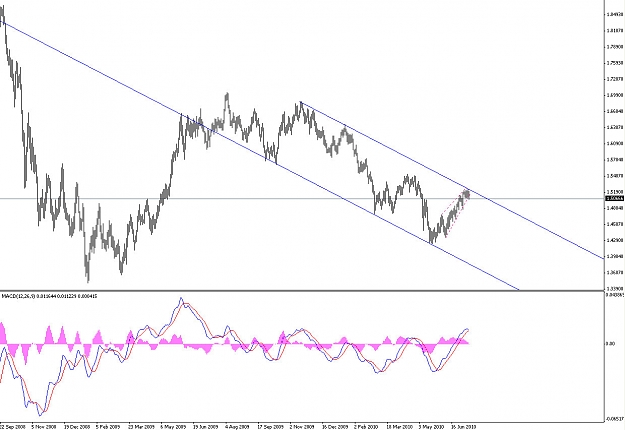
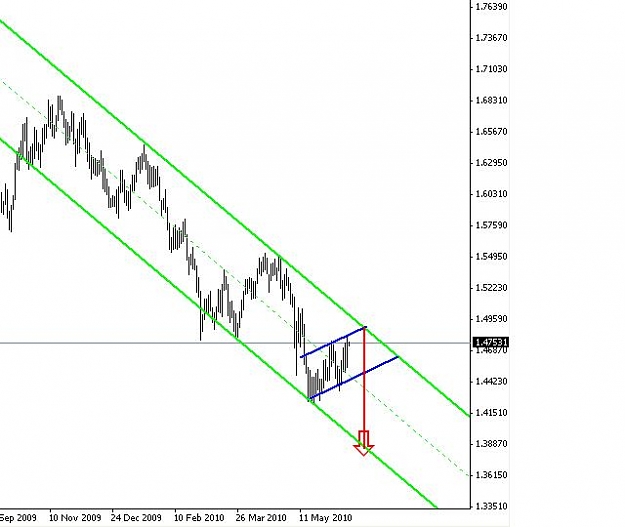
USD/JPY Discussion
- jsspmk replied Jul 9, 2010
Daily equidistant channel, IMO risk/reward is appropriate to short/consider short.
Spot FX Day Trader's Thread
- jsspmk replied Jun 13, 2010
Solid line is 50% of all time range, dotted lines are 1999 Open & High
Spot FX Day Trader's Thread
- jsspmk replied Jun 13, 2010
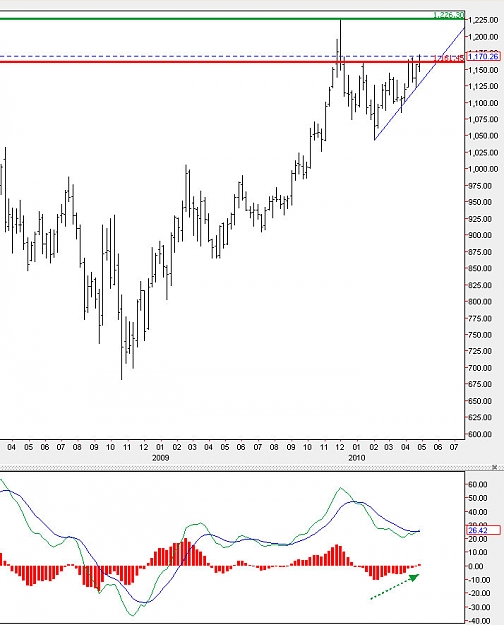
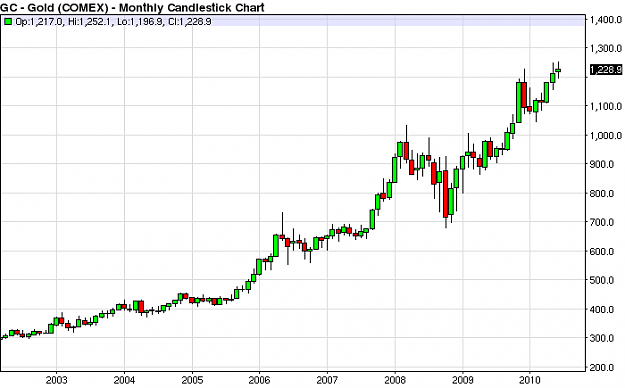
What a crap game that was! Total waste of time & beer, not so much the latter. Regarding yearly OHLC. Gold 2009 High was 1,226.40, last week closed 1,228.9, so that is a confirmed breakout against 2009 High. IMO gold will leave 1226.4 as support now.
Spot FX Day Trader's Thread
- jsspmk replied Jun 6, 2010
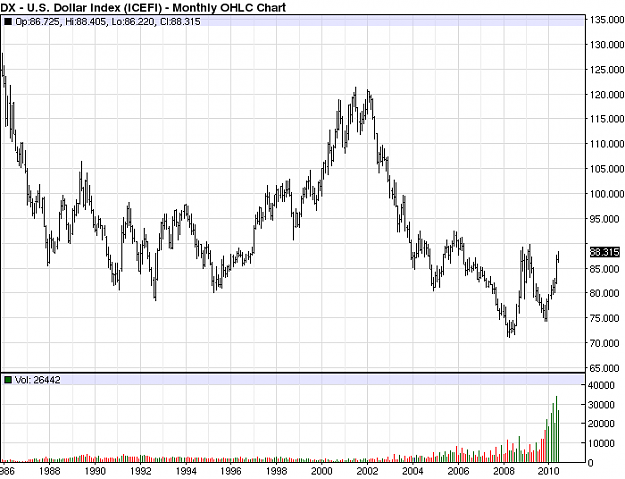
Both Daily & Weekly charts in DX have confirmed breakouts against 87.6. But previous resistance is of 89s is close by. Yet check out current monthly volume in DX, it's huge. That suggests that it is time to start looking to get short equities. We ...
Spot FX Day Trader's Thread

- jsspmk replied May 13, 2010
Monthly chart of DOW Transportation points to why oil has to pullback to enable stocks to keep climbing.
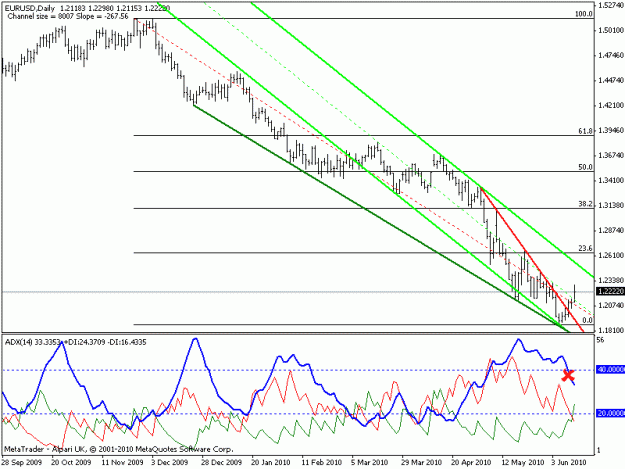
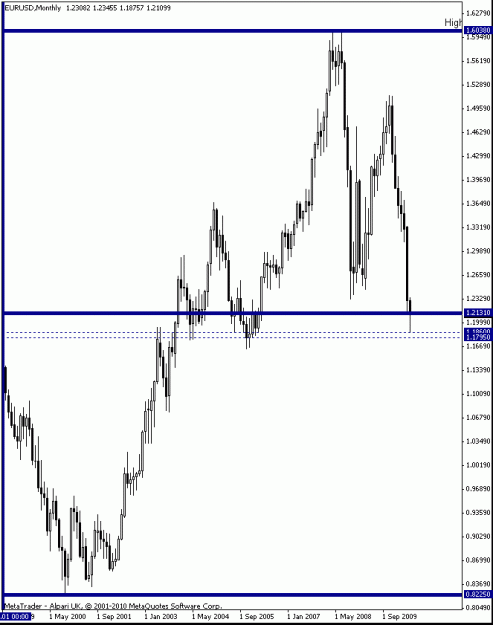
EURUSD
- jsspmk replied May 13, 2010
Also to see how "great" things are in Euro check out EUR/AUD Monthly chart. Australia hasn't been blessed with a recession. Check out this flight to safety out of Euro!
EURUSD
- jsspmk replied May 11, 2010
I don't know who would be position buying Sterling here, look at this monthly chart. Biggest deficit in Europe, Tories will attempt to cut everything I suppose, but as the recent article in the FT said - Europe is not ready for austerity measures. ...
Cable Update (GBPUSD)
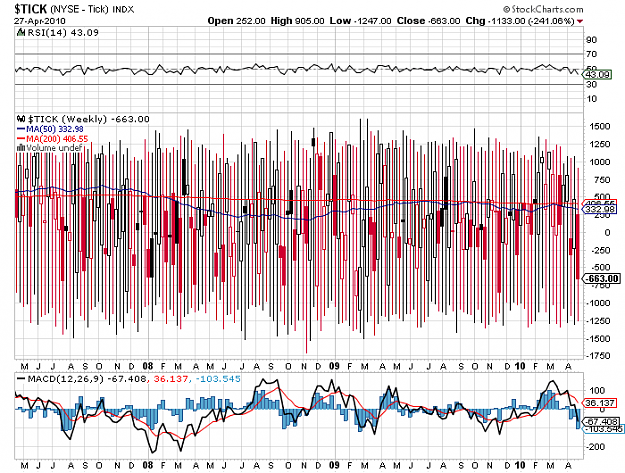
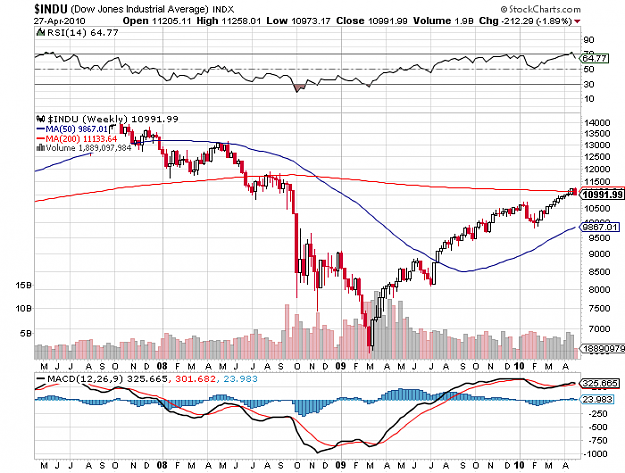
- jsspmk replied Apr 27, 2010
Stock markets are on the verge of a cliff IMO. "Sell in May & go away" is upon us. Weekly TICK is looking very very bearish as far as bearish patterns are concerned. USD going through 2008 close suggests that it is not possible to contain its ...
EURUSD