- Search Metals Mine
- 40 Results
-
 galaxymom replied Sep 2, 2008
Hi bjpumping, I'm not Bo, but I can help. 1. Yes you can fib any time frame. 2. In general you place the 0% and 100% on the low of the previous day and the High of the previous day, respectively (see example). 3. You can use Fibs with any pair, and ...
Fibonacci Trading with Bobokus
- galaxymom replied Apr 7, 2008
Bo is using the Trend Fib, Retracement Fib and if needed a Leg Fib on the Daily Chart ( See Pic). and on the H1 Chart the Intraday and the Swing Fibs (see pic) You can use the channel if you need it. He has revised the set he posted on the first ...
Fibonacci Trading with Bobokus
- galaxymom replied Mar 19, 2008
We are really being hit with a lot of news, and some of that not planned these past few days, and possibly through the week. There maybe a lot of these crazy moves, and they will be hard to fib, at least that's what some people say, but if you take ...
Fibonacci Trading with Bobokus
- galaxymom replied Mar 18, 2008
This would be the way I would have the fibs on this chart. Hope this helps.
Fibonacci Trading with Bobokus
- galaxymom replied Mar 17, 2008
Here's how would have it set up, hope this helps.
Fibonacci Trading with Bobokus
- galaxymom replied Mar 16, 2008
Here are some more examples That should say Watch instead of What for this pattern
Fibonacci Trading with Bobokus
- galaxymom replied Mar 16, 2008
I had some charts saved with examples, I hope these help. 1. Where the Short/Low is broken and price reverses to the Long/High 2. The three white ovals show the Pierce-reversal pattern
Fibonacci Trading with Bobokus
- galaxymom replied Mar 16, 2008
Right, it pierced the Intraday Low and bounced back to the Swing Long, making railroad tracks, watch for that formation.
Fibonacci Trading with Bobokus
- galaxymom replied Mar 16, 2008
I would be careful at the moment, I've already taken a short, and the stoch's has started crossing up. Also, you might reconsider your Intraday fib.
Fibonacci Trading with Bobokus
- galaxymom replied Mar 13, 2008
Unless you are looking to really long term trading, you need to go to the Hourly chart to look for entries, there are over 400 pips in your box and your Target is over 400 pips from the long. Most of us are trading from the Hourly chart, although we ...
Fibonacci Trading with Bobokus
- galaxymom replied Mar 13, 2008
Like this, then you can pull another fib on the up move if you like.
Fibonacci Trading with Bobokus
- galaxymom replied Mar 11, 2008
Ian, Here's a look at the DownTrend fib, currently. Hope that helps.
Fibonacci Trading with Bobokus
- galaxymom replied Feb 27, 2008
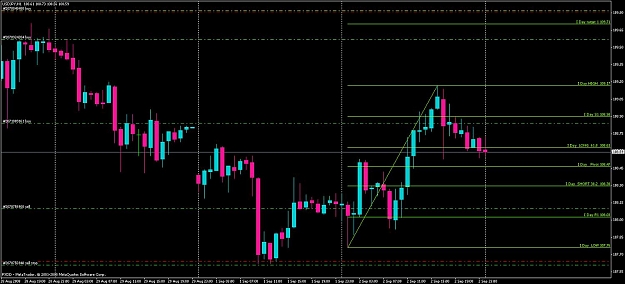
We don't move our Intraday fibs until the new day begins in our afternoon here in the US. Here's my chart, what we see is the Swing Low about to break.
Fibonacci Trading with Bobokus
- galaxymom replied Feb 27, 2008
Here's my take on it, the Retracement Low has been broken, so in fact the DownTrend has resumed.
Fibonacci Trading with Bobokus
- galaxymom replied Feb 27, 2008
I think your Swing fib is incorrect. I think either of these could be better choices.
Fibonacci Trading with Bobokus
- galaxymom replied Feb 23, 2008
If I may, When price is ranging, and in this case above the IDay long, you look for opportunities to trade as it bounces back and forth and you have to use the Swing fib levels to find the scalp trades. There was a approx. 60 pip candle and two 40 ...
Real Time Fibonacci Analysis
- galaxymom replied Feb 19, 2008
These are the fibs I would have drawn, the green Swing is the next to last and the Red is the last.
Fibonacci Trading with Bobokus
- galaxymom replied Feb 18, 2008
Gbenga First you have to find support and resistance of the last wave if drawing the Swing or the High/Low of the previous day. T1 is 1.382 and -0.382 in the fib levels of the fib properties of the tool. You have to draw the fib, left click the ...
Fibonacci Trading with Bobokus
- galaxymom replied Feb 14, 2008
Here's the entry's on a chart, with approximate candles marked for GU. I posted the times above, I use fxdd and I believe times are GMT+2. The trading day changes at 4pm CST. Hope this helps.
Fibonacci Trading with Bobokus