- Search Metals Mine
- 36 Results
- blackstar replied Nov 15, 2012
EURX and USDX 5 min charts. As you can see, there's quite the contrast.
EURUSD
- blackstar replied Oct 15, 2012
Here's mine, Up top is the two day average, and on bottom is 50% of the 2008 move.
EURUSD
- blackstar replied Apr 2, 2012
USDX and EURX daily chart comparison. It looks like we could be in for some big moves.
EURUSD
- blackstar replied Mar 25, 2012
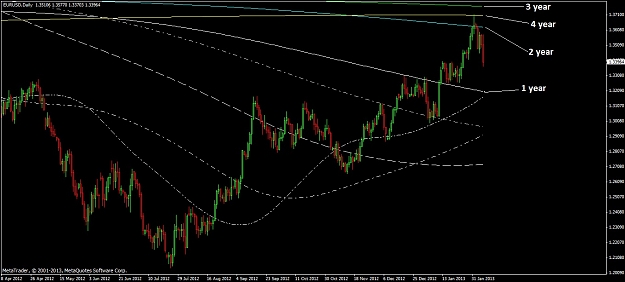
Here's some levels I'm watching, maybe someone will find this useful. The first chart are historic turning points/supply&demand around the price we're at now, and some trendlines. White: 1991-2000 Blue: 2000-2010 Green: 2011 1991-2000(lowest to ...
EurAnalysis
- blackstar replied Mar 15, 2012
Last picture I promise. Another example of weak buying on cross
EURUSD
- blackstar replied Mar 15, 2012
Today the daily 180 closed in on the d1 1080 which definately helped the rally, but yesterday the 1hr 18 crossed 1620, and today 27 went flat right on the 1620. Right as 27 went flat 18 was crossing back above it, and it was also at that time that ...
EURUSD
- blackstar replied Mar 14, 2012
Well price has held below all its averages today. Which makes this an interesting situation. A lot of people might consider this a good buy and a lot of people probably think it's good sell. I have a feeling the next few weeks will be pretty wild.
EurAnalysis
- blackstar replied Mar 13, 2012
Sure, first you have to right click any indicators you have open and click delete. Then you have to right click your chart, go to properties, click 'colors' and change everything to the same color. If your chart doesn't look like the one below, ...
EurAnalysis
- blackstar replied Mar 13, 2012
Moving averages are amazing and one of the most under-rated tools in trading. My head almost exploded too when I realized what everyone has been over looking all these years even though it was right in front of them. These specific ...
EurAnalysis
- blackstar replied Mar 13, 2012
Here's a chart showing this. You have to set it to scale fix 1 to 1 and zoom in quite a bit to see these intricate crosses/flattening because from the normal perspective they all look flat.
EURUSD
- blackstar replied Mar 13, 2012
It looks like we are at big decision point in history, we've bounced from the Jan-Feb 50%/ All time 38.2%/ Weekly 9 t3ma three times today. Either the current uptrend will continue or price will break support. Either way the moves could be huge. ...
EurAnalysis

- blackstar replied Mar 12, 2012
6 weak 4hr bull bars in a row, and the 4hr 180 is about to cross above the 4hr 360. I see it possibly getting to 1.3225 before making a significant correction, but it needs a correction and the 180/360 cross could be where that happens. Of course ...
EURUSD
- blackstar replied Mar 5, 2012
I still haven't given up on the bulls, the last time 810 met 1620 was April 27th 2011 when 810 crossed above 1620 which was the same day the uptrend stopped dead in it's tracks. In 3 and a half hours 810 will cross below 1620.
EURUSD
- blackstar replied Mar 4, 2012
Originally I thought the 4hr 180 would cross the 4hr 270 at the same time 810 crossed below 1620, but 180 crossed above 270 on Friday which I'm sure was a contributing factor to the sell off. Today 810 will hit 1620 at the beginning of the next 4hr ...
EURUSD