- Search Metals Mine
- 10 Results
-
 Taiyin8 replied Dec 28, 2015
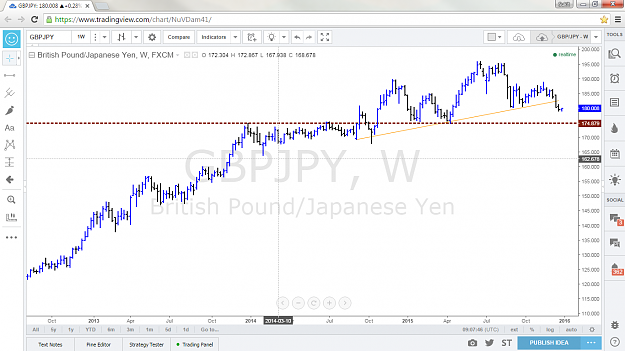
Could be one of the major trades for 2016. Below 175 could mean a massive H&S Top. (Weekly chart: A little longer term)
Dragon Riders GBP/JPY
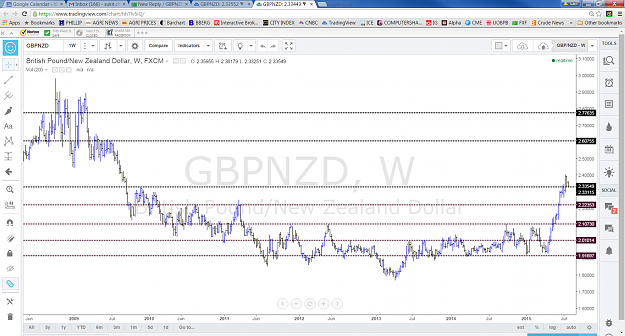
- Taiyin8 replied Jul 28, 2015
Weekly chart suggests critical juncture. A move below last week's low of 2.329 could mean that the surge two weeks ago was a bull trap and 2.33 is now a major overhead resistance.
GBPNZD trading calls
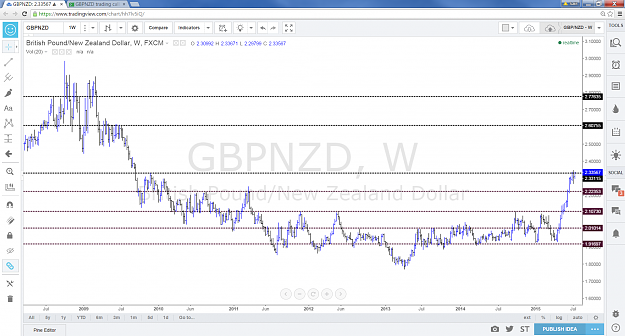
- Taiyin8 replied Jul 15, 2015
Third week of consolidation at the current resistance. Hopefully, this would now act as a base for support if the pair could break through.
GBPNZD trading calls
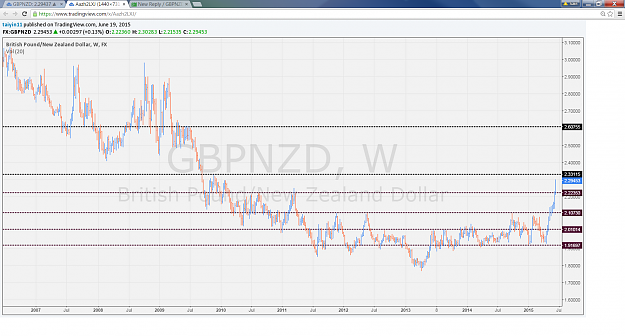
- Taiyin8 replied Jun 19, 2015
Taking the longer term view (weekly), we just blasted through resistance at 2.22. Next resistance is the current 2.30 - 2.33 area. Then, I don't see too much strong resistance until 2.60 range. image
GBPNZD trading calls
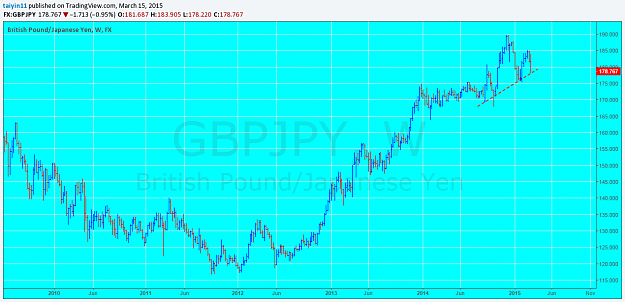
- Taiyin8 replied Mar 15, 2015
Weekly chart, so for the longer term trader. Not a perfect H&S formation, but seems quite compelling. A break from current levels could be very bearish for the pair.
GBP/JPY
- Taiyin8 replied Mar 2, 2015
Looks like a potential upside break, at first glance. But, given that it failed to sustain an upside break over the past three attempts and each time unable to get higher high, my money is on another bear trap.
USD/CAD
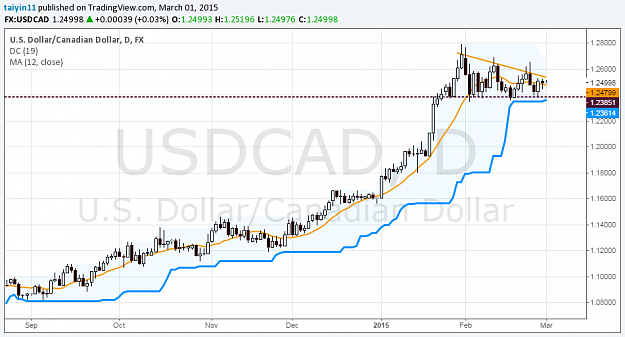
- Taiyin8 replied Nov 27, 2014
Longer term weekly chart suggests a move towards a critical juncture. A bounce off 1.0730 is required, otherwise a major decline. My two cents. image
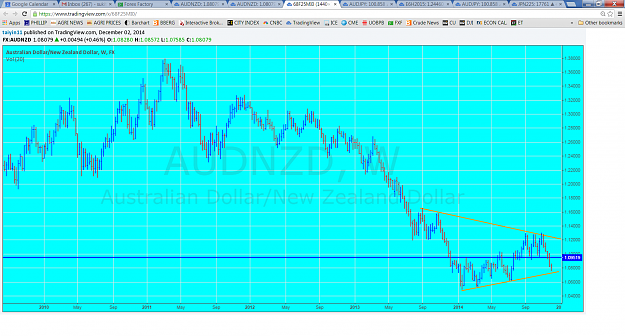
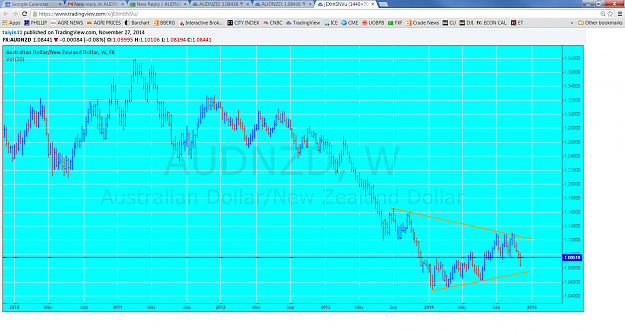
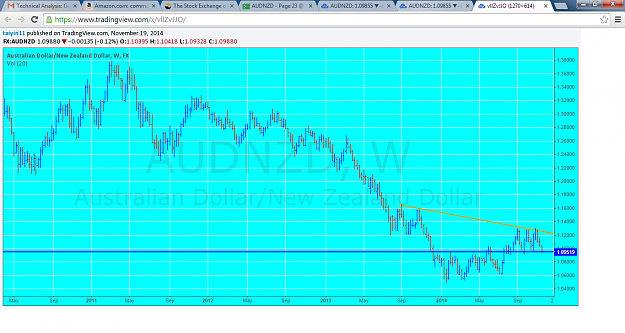
AUDNZD
- Taiyin8 replied Nov 19, 2014
I might be too long term, but weekly chart suggests a potential downside break. image
AUDNZD
- Taiyin8 replied Nov 17, 2014
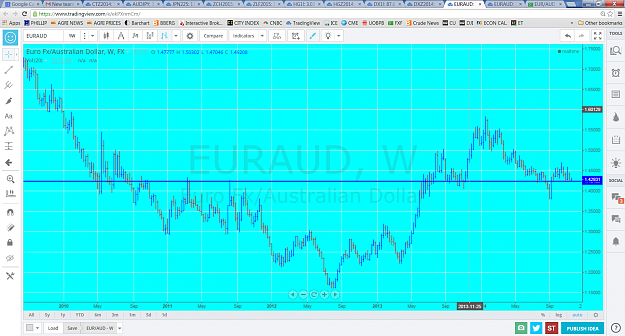
Another false break (a la September) or a potential 700 pips drop (at least on the weekly). image
EUR/AUD
- Posts by Member Search: 'Taiyin8'