- Search Metals Mine
- 20 Results
-
 Sandy1994 replied 41 hr ago
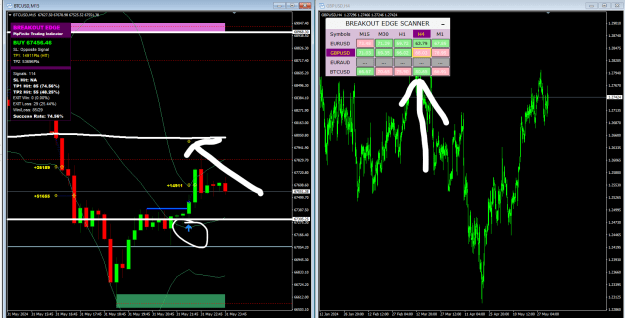
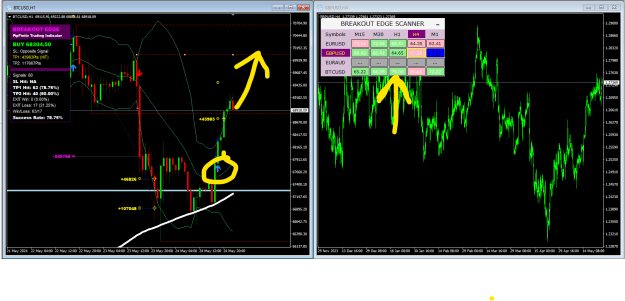
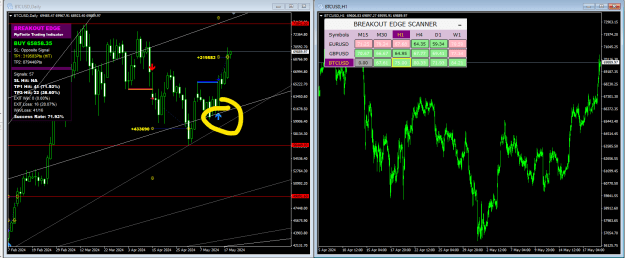
I still remain bullish on the 4 hourly charts as the support at the bottom remains to strongly the support the bottom. According to this confluence as shown on the image, I will be buying bitcoin and taking profit at 68001
Bitcoin (BTCUSD)
- Sandy1994 replied May 30, 2024
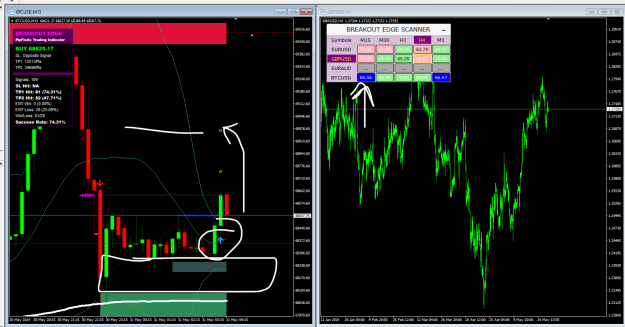
As previously analyzed on the above image from yesterday, bitcoin went to take profit. I still got a confirmation of a double bottom on bitcoin from the 4 hourly charts on an uptrend plus other confirmation confluences as pointed on the image below. ...
Bitcoin (BTCUSD)
- Sandy1994 replied May 29, 2024
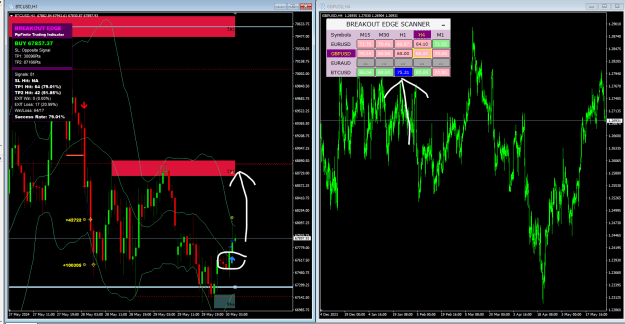
I got a confirmation of a double bottom on bitcoin from the 4 hourly charts on an uptrend plus other confirmation confluences as pointed on the image below. I got it buying to 68744, which is the resistance level.
Bitcoin (BTCUSD)
- Sandy1994 replied May 28, 2024
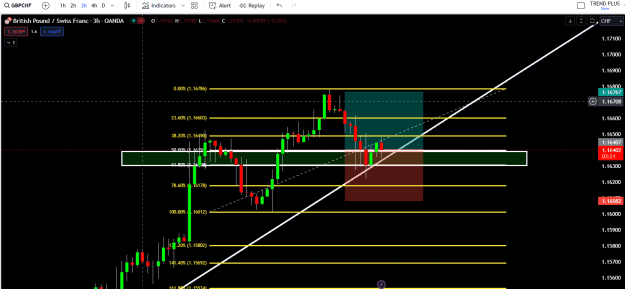
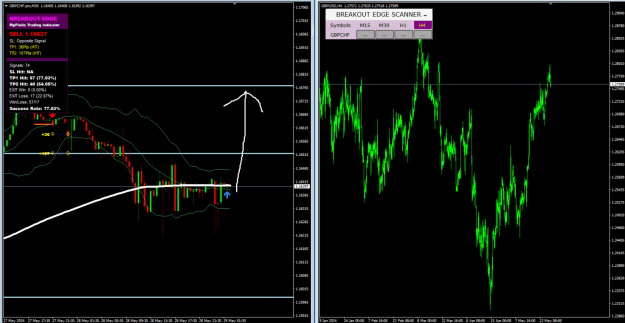
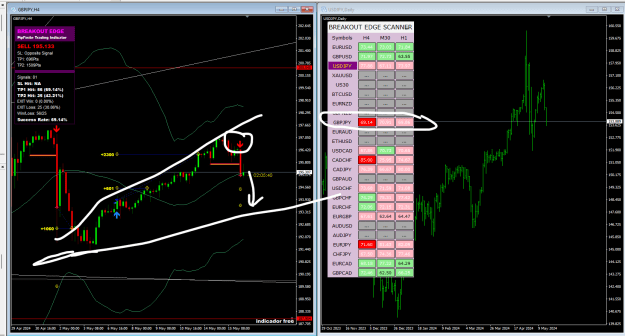
What do you guys think. I got GBP/CHF going up based on my technical analysis drawn below along with other confirmation confluences.
GBP/CHF and USD/CHF
- Sandy1994 replied May 27, 2024
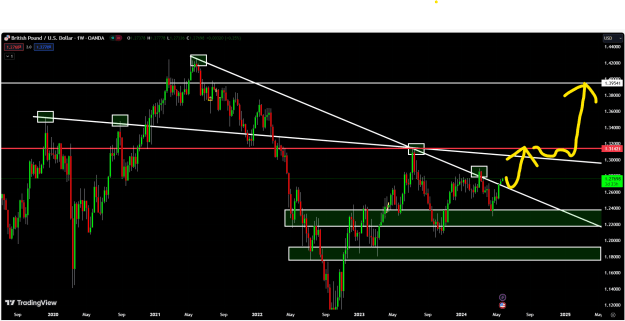
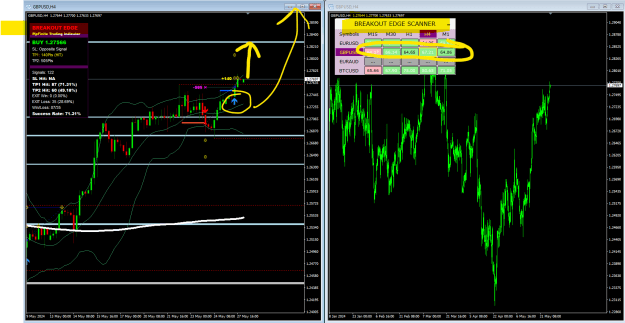
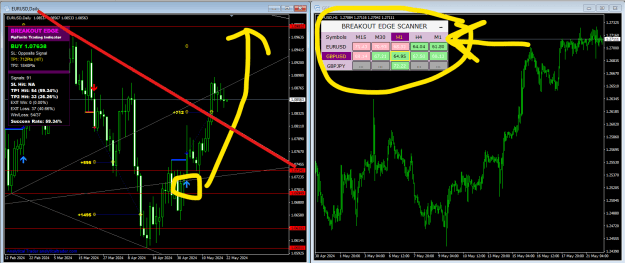
I got a confirmation signal from GBP/USD that indicates bullish momentum after the breakout confirmation. I got buying GBP/USD long term. FOR GBP/USD it broke a massive trendline to the downside, and it can either make a small retracement downwards ...
GBP/USD and EUR/USD
- Sandy1994 replied May 24, 2024
I see bitcoin buying after this breakout to 70057.89. Bitcoin had created its lowest point plus liquation on the 1 hour chart.
Bitcoin (BTCUSD)
- Sandy1994 replied May 23, 2024
After this initial ranging on the 1 hour chart and after the breakout confirmation, I see it continue going up on EUR/AUD
EUR/AUD
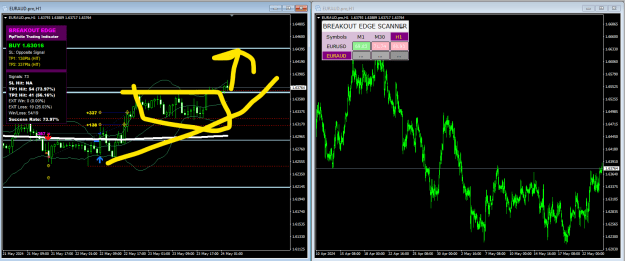
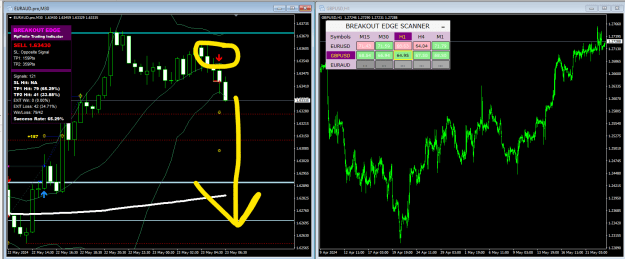
- Sandy1994 replied May 23, 2024
Accoording to my analysis there's a bearish divergence on the 1 hours chart, therefore, i am selling eur/aud all the way down to 1.623942. Let's go guys !!
EUR/AUD
- Sandy1994 replied May 21, 2024
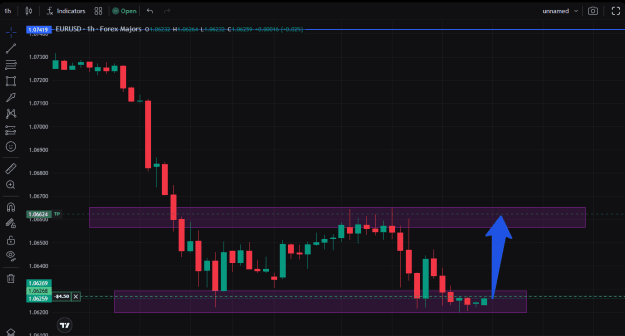
I see EUR/USD going long and will continue its upwards movement after this trendline break from the daily chart followed by an additional confluence as seen on the screenshot that I posted here. EUR/USD is going to continue buying to the next ...
EURUSD only
- Sandy1994 replied May 20, 2024
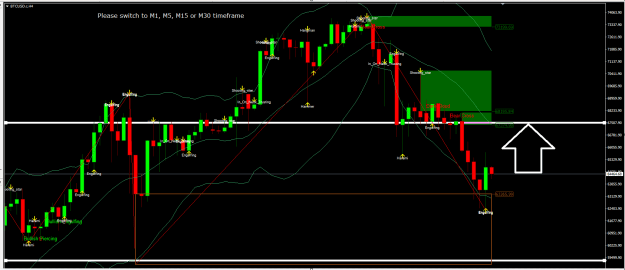
My analysis on bitcoin. I do see bitcoin hitting take profit two. Trendline broke. Strong upwards movement.
BTC/USD breakout strategy
- Sandy1994 replied May 16, 2024
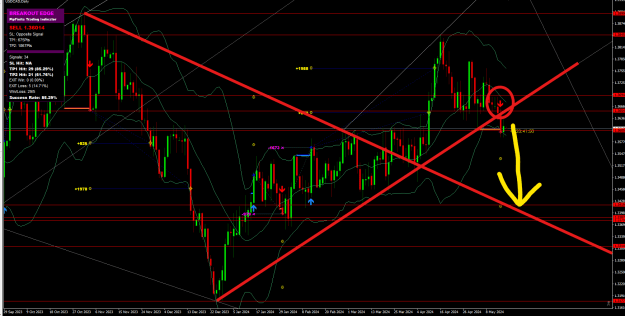
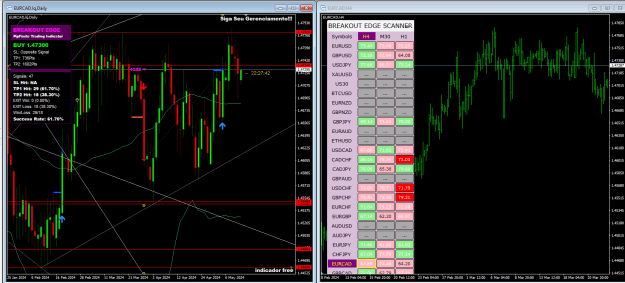
This is my analysis on USD/CAD. USD/CAD has already made a retest on the daily chart after the trendline break, I expect price to keep tanking all the way down to 1.34192. This the next wave.
USD/CAD
- Sandy1994 replied May 14, 2024
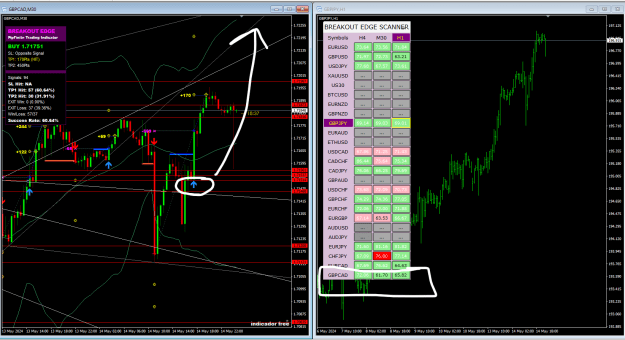
GBP/CAD is going to buy after this nice trendline break followed by the confirmation of these nice parameters.
What about Bitcoin... :)
- Sandy1994 replied May 13, 2024
According to my analysis of the trendline breakout on EUR/CAD, I see it buying long term from the 4 hourly chart.
EUR/CAD
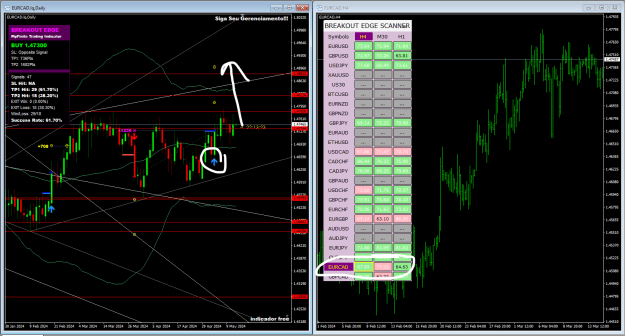
- Sandy1994 replied May 12, 2024
I have EUR/CAD going long for a buy according to my analysis as the trend is up on the daily chart. It's ranging at the current moment but once the trend breaks, it's going up.
EUR/CAD
- Sandy1994 replied May 10, 2024
Eur/usd breakout trendline broke, what do you guys think of buying eur/usd next week?
EURUSD only

- Sandy1994 replied Mar 19, 2024
I am buying bitcoin now and taking profit at 67,500.
Bitcoin (BTCUSD)
- Posts by Member Search: 'Sandy1994'