- Search Metals Mine
- 17 Results
-
 ForexSamsam replied Feb 7, 2016
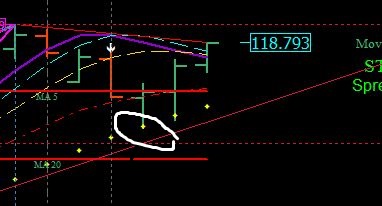
On UJ, i see ema as resistance and it been broken on friday i enter long when the psar flip. it very risky because i'm again the ROMAR on both chart..
The Paradox System
- ForexSamsam replied Jan 28, 2016
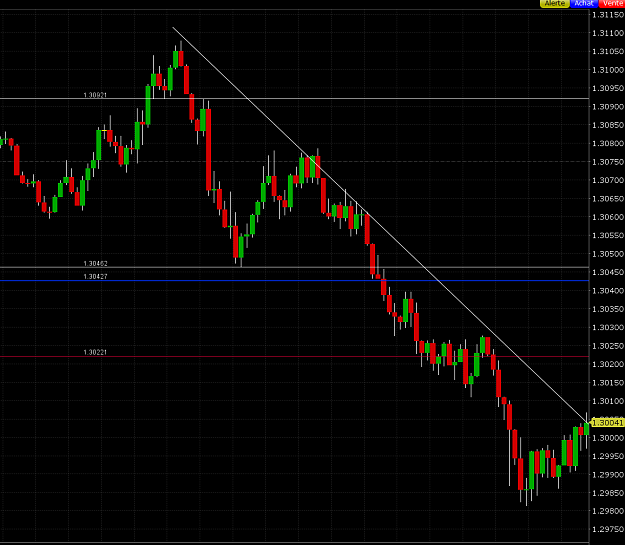
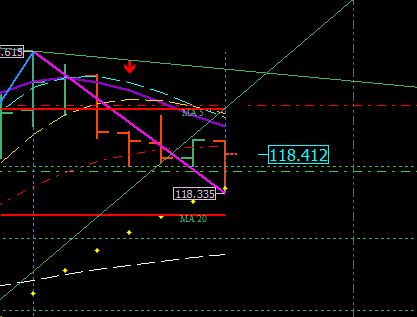
The H2 give the trend.. how can we see evidence of new trend in that ?? every line at the same place.
The Paradox System
- ForexSamsam replied Jan 28, 2016
i short at the contour line.. i dont see any evidence sign of new trend
The Paradox System

- ForexSamsam replied Jan 26, 2016
I use on H1 the touch of the Psar and the parabolic as entry pont for a long. The H2 is always in uptrend and the pair goes below the ema support
The Paradox System
- ForexSamsam replied Jan 25, 2016
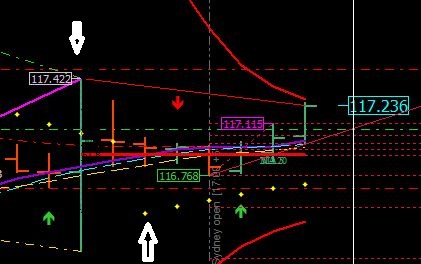
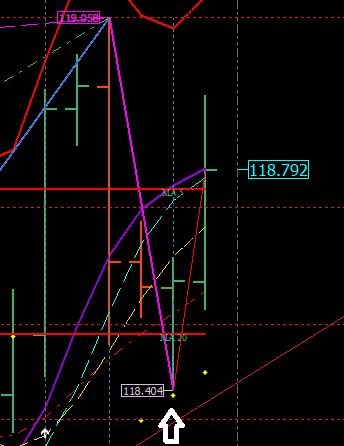
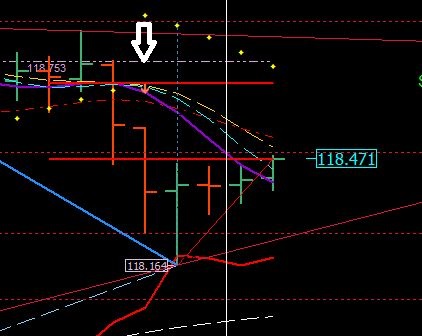
i guess.. the trade of the night was this one (i miss it) White and smooth have crosse purple et psar flip on H1
The Paradox System
- ForexSamsam replied Nov 27, 2015
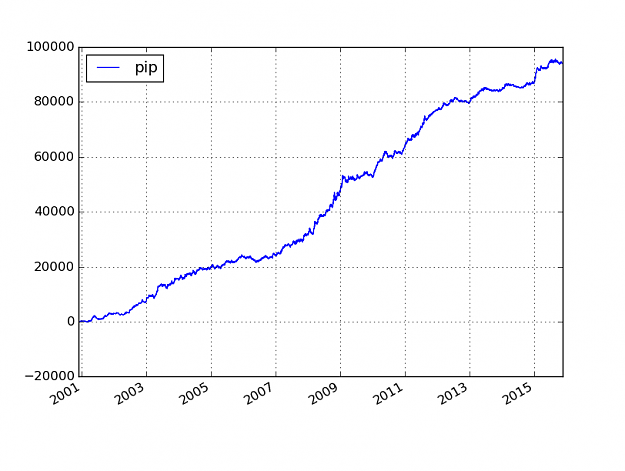
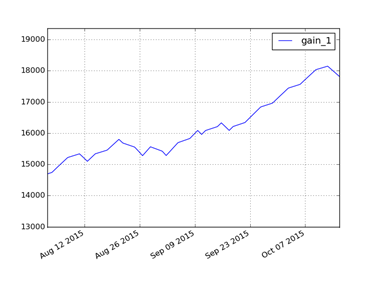
With 6 pairs mix R = .9731 Maybe we can improve again with half hour timeframe ?
Machine Learning with algoTraderJo
- ForexSamsam replied Nov 17, 2015
3 pairs mix EURUSD, EURJPY and USDCHF each have it's own parameter
Machine Learning with algoTraderJo
- ForexSamsam replied Nov 12, 2015
I have something very strange, i get same result than you but 12h later. Your 8h is for me 20H. 8AM in GMT+1 is the end of Sydney session, this not a very decisive time for EURUSD.. i think. ? My 20h seems to have more sens, this after the end of ...
Machine Learning with algoTraderJo
- ForexSamsam replied Nov 9, 2015
I get something not too far from your resul (trailing sl version). I also force a issued for the output at the end of the horizon if i get only a SL or TP. Without that i dont have enough data (2 years of data before first prediction!) But my result ...
Machine Learning with algoTraderJo
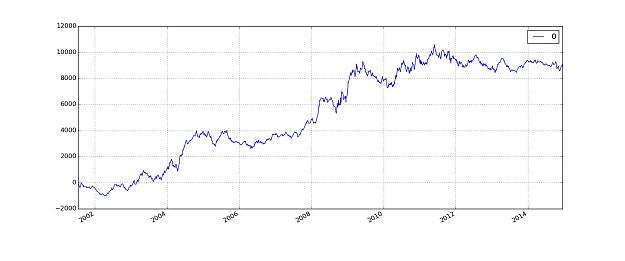
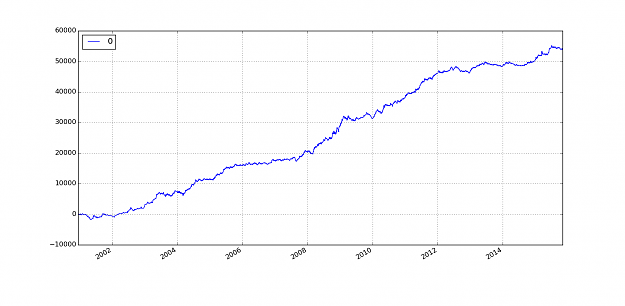
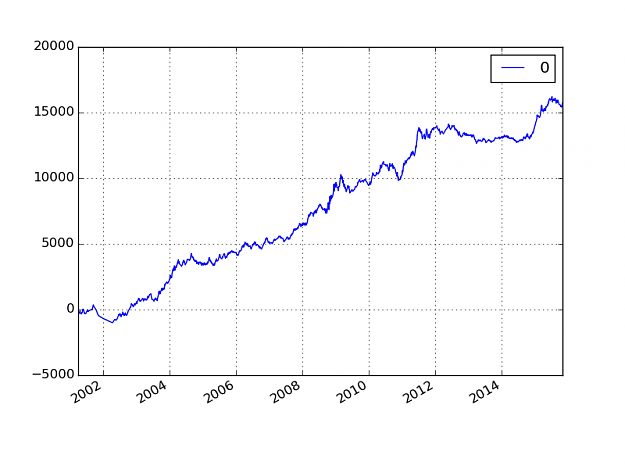
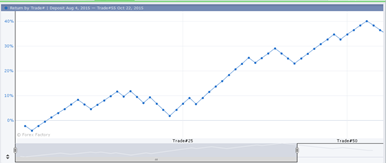
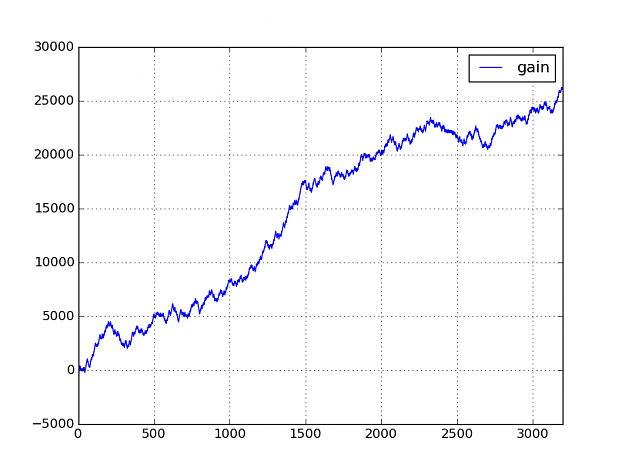
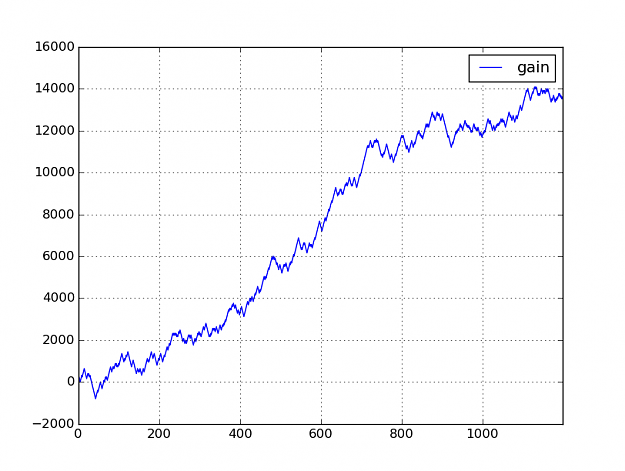
- ForexSamsam replied Nov 8, 2015
Real word vs simulation The close day of the trade is not same in two figure but i think i still interesting August to October this with the first version of the SVC image image
Machine Learning with algoTraderJo
- ForexSamsam replied Jun 14, 2015
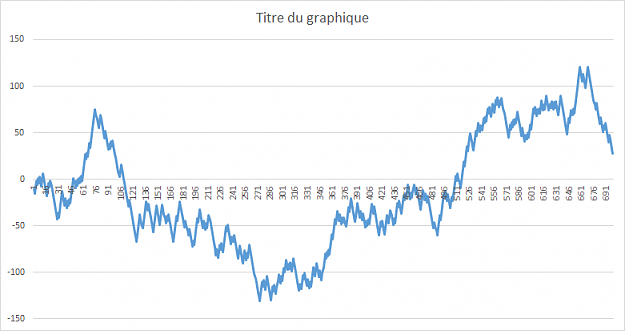
14 Years tick with SVC and 104 samples EUR_USD I need a super computer !
Machine Learning with algoTraderJo
- ForexSamsam replied Jun 13, 2015
10 years (1994-2014) simulation with EURUSD with +0.8ATR =1 and -0.8*ATR =0 This with SVC with 104 samples and gamma = 0.006. I encode my inputs with [-2,-1,0,1,2] with 6 days as inputs. I use python Pandas with every tick to get this. :-)
Machine Learning with algoTraderJo
- ForexSamsam replied Nov 10, 2014
I improve your strategy with a minimum candle height of 5 pips (2 consecutive candle of 5 pips) I also add 5Minute SMA with timeperiod of 10. This for trend confirmation juste before enter. I set a TP of 10pips and SL of 30pips. Then this begin to ...
Simple "Make Pips" Strategy
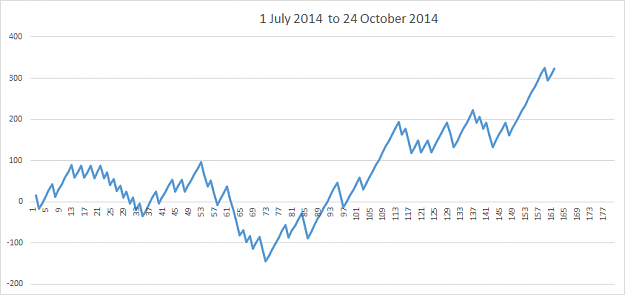
- ForexSamsam replied Nov 9, 2014
I try this on my Backtester with EUR_USD TP must be greater than SL .. here my result with 5/7 pips for the last 3 month Maybe better result on low volatility ?
Simple "Make Pips" Strategy
- Posts by Member Search: 'ForexSamsam'