- Search Metals Mine
- 10 Results
- CharlesSA replied Jul 13, 2010
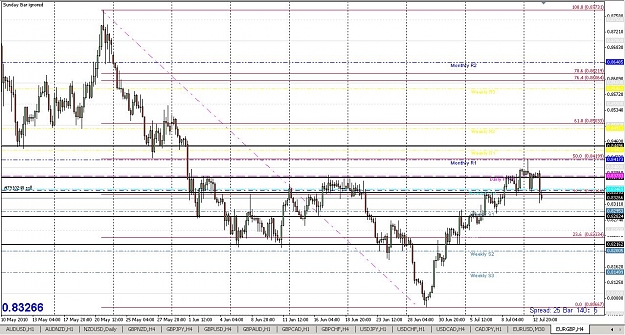
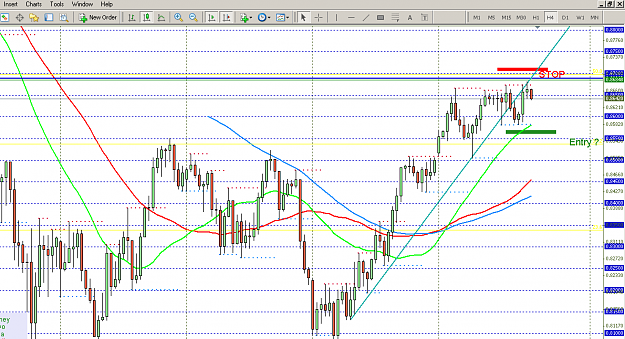
Also took that trade. The level is also very close to the 38.2% fibb (which is less important, but still. ) I know my chart looks a bit busy still but atleast I know what is going on
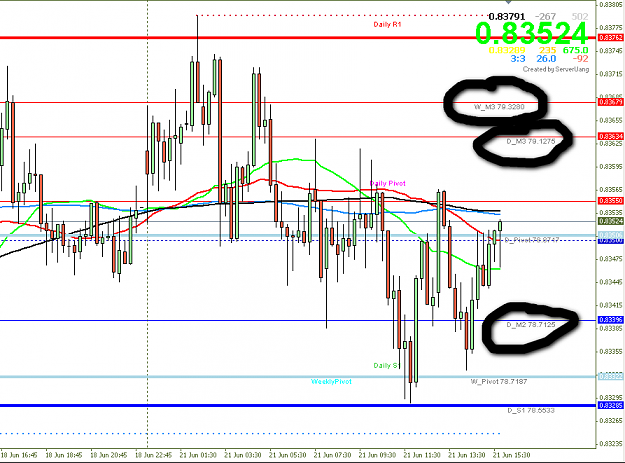
Trend Trading All Pairs My initial target TP on this one is 0.82824. Does that sound ...
- CharlesSA replied Jul 8, 2010
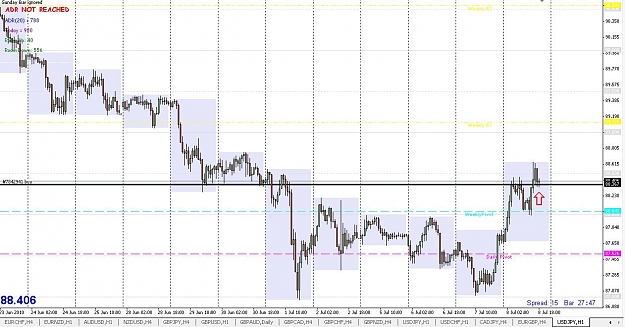
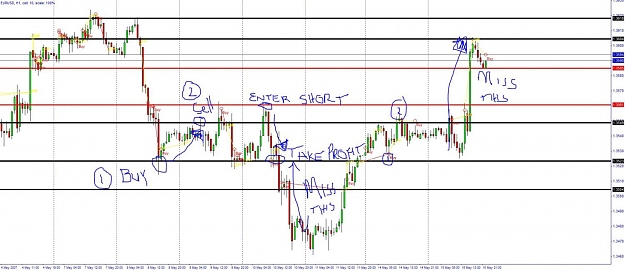
Wow, some great posts with very valuable info. Thanks! Well, here are two trades that I hope will work out. First is EUR/GBP, short at black line which seems to be a good S/R level. Second, long USD/JPY at black S/R level. On the hourly and 4 hourly ...
Trend Trading All Pairs

- CharlesSA replied Jun 27, 2010
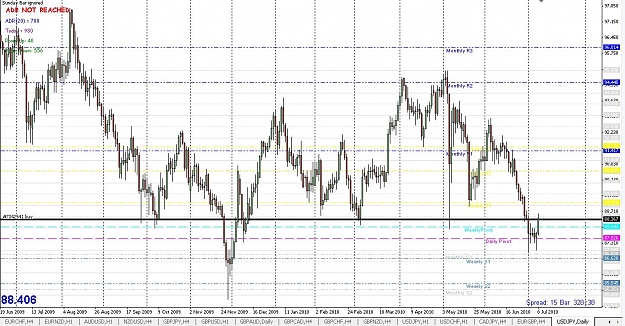
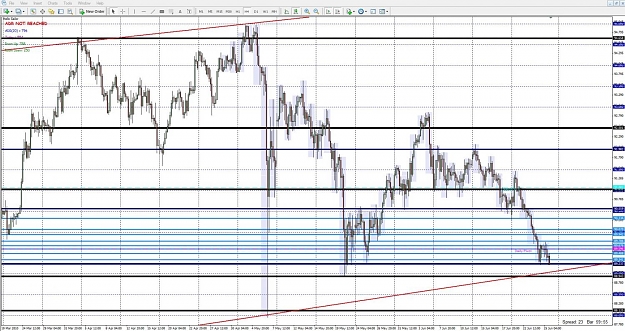
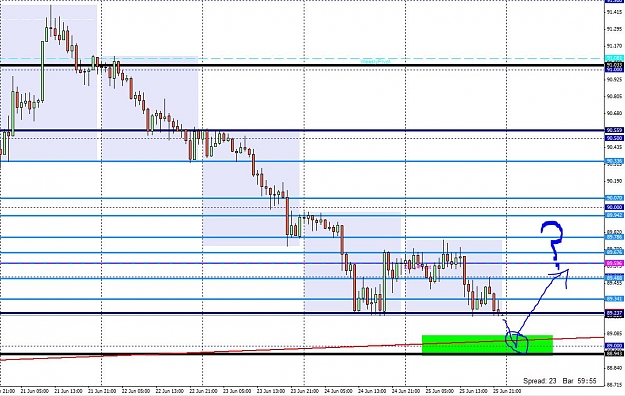
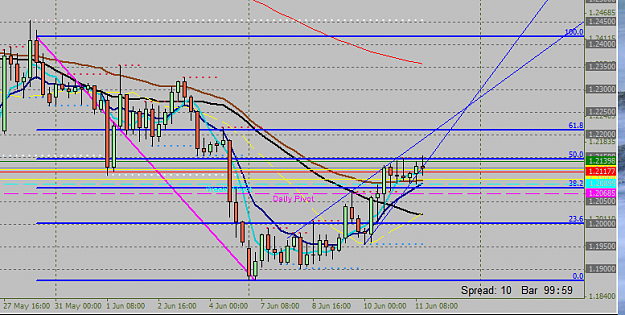
USDJPY - Potential setup for this week? — Could this be a potential setup to wait for this week? USDJPY Daily, 4 Hourly and Hourly chart attached: Black Lines depict Weekly S/R Levels Dark Blue Lines depict Daily S/R Levels Light Blue lines ...
Trend Trading All Pairs
- CharlesSA replied Jun 27, 2010
Thanks Custos. Your help is very much appreciated here. I read through the No Brainer PDF manual on S/R trading. Thank you so much for having posted the link. With regards to this "system", do you look for a minimum risk reward ratio before ...
Trend Trading All Pairs
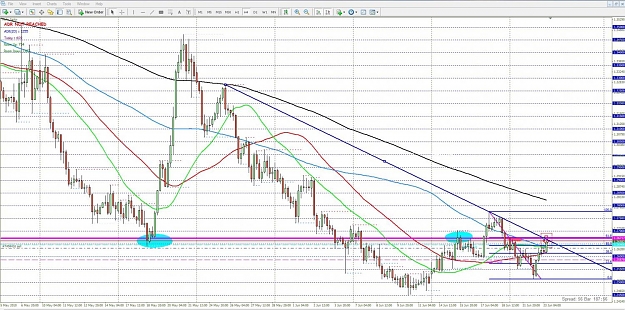
- CharlesSA replied Jun 25, 2010
GBP/USD — GBP/USD It is a friday and I am not keen on entering a trade this late. However, what do you guys think of this setup? Top black SR seems ideal for a short as it is close to a round number as well as the 61% Fib level. PA seems to ...
Trend Trading All Pairs
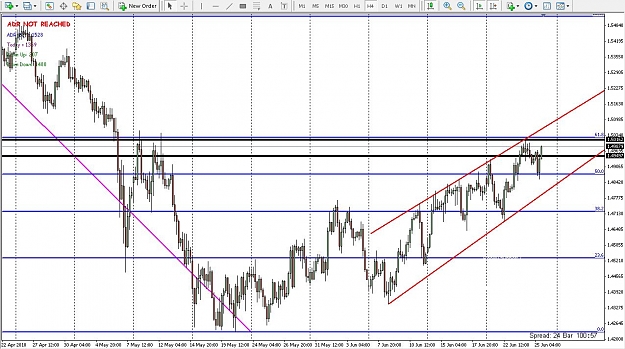
- CharlesSA replied Jun 23, 2010
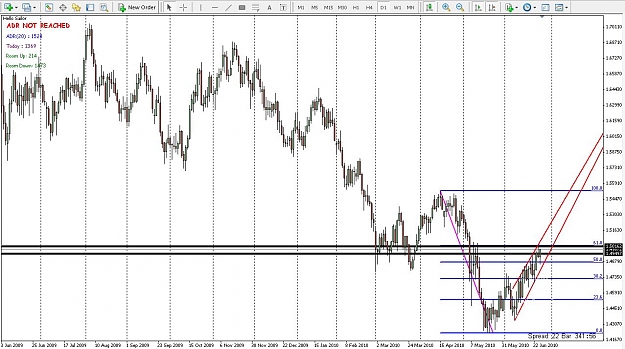
Is this a potential short setup forming? — Chart: EUR/CAD The majenta line (resistence), 61.8% fib and trend line seem to confluence in the general area of 1.26717. Could this be a potential short opportunity? The main trend is down.
Trend Trading All Pairs
- CharlesSA replied Jun 21, 2010
Hi Red Thank you su much for taking the time to respond. I was aware that M stands for monthly, D for Daily and W for weekly. However, my question was not clear enough... I have attached a screenshot to show you what I mean. There are some lines on ...
What does M1, M2 etc stand for in Pivot lines?
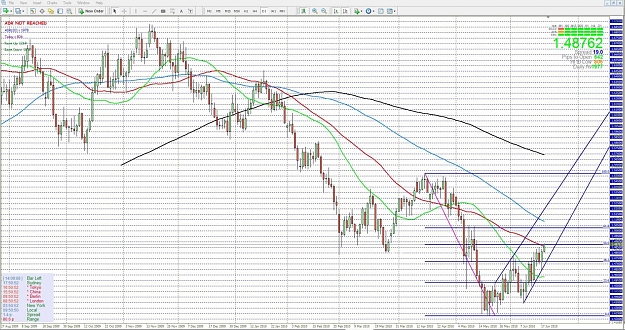
- CharlesSA replied Jun 18, 2010
PAIR: GBP/USD on Daily TF While looking through the charts this morning, I came across this setup. Is there any significance to this as a potential sell opportunity? The retracement has reached 50% fib and is close to RN 1.4900. However, PA is still ...
Trend Trading All Pairs
- CharlesSA replied Jun 17, 2010
Thanks for bringing it to my attention... I use the opportunity to then draw the fibs, spot RN's etc while I am getting used to this technique. Do you mind posting a sample chart where one's entry position would be so that I can get a better ...
Trend Trading All Pairs
- Posts by Member Search: 'CharlesSA'