- Search Metals Mine
- 29 Results (4 Threads, 25 Replies)
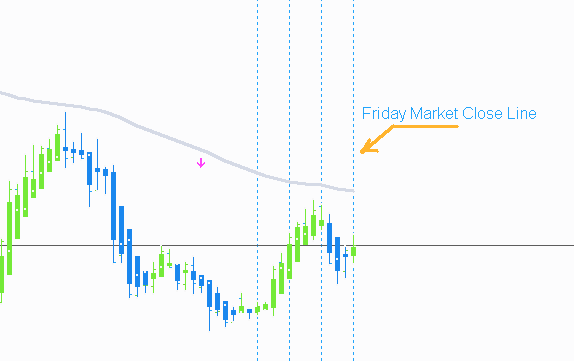
- Bernardi replied Jan 8, 2017
Thank you, but i already found what i need. I replaced the MA line with MA coloured candles with an alarm and arrows (dots actually xD). I used the indicator from BBalazs a few posts earlier, strategy is still the same, just a visual difference. ...
- Bernardi replied Jan 7, 2017
Oh i almost forgot... You mentioned in the video, that waiting for a retrace before we enter might be a good idea, and i think it is! its filtering out even more bad trades. So additionally to the ranges, i am always waiting for a retrace between 50 ...
- Bernardi replied Jan 6, 2017
That range breakout is not easy to explain, because i can not really quantify the rules to draw the range, but i will do my best to explain... A range usually is some king of sideways trend with no new Highs or Lows, while price is touching the ...
- Bernardi replied Dec 30, 2016
Not sure what you are searching for, but there is all you need in the file attachements tab, click on that: image Ma in Color for example is the 35/175 LMWA if you want to use the original system, which is really good and simple. Me personally, ...
- Bernardi replied Dec 26, 2016
I am searching for the Indicator, that shows me the color of the current AND historical HA Candles of the higher Timeframes, does anyone know which one it is? Looks something like this: image
- Bernardi replied Dec 20, 2016
And we Just had a very common Completion on UJ right before D as i was writing the previous post: Setting for example for that Trade was ATR7: 3 + spread 2 = 5pips SL, TP is right before D, in this Case 15 pips, makes 300% Profit ...
- Bernardi replied Dec 20, 2016
I draw the ABCD Leg when the MA Color changes, because that means C is formed, and Price is about to reach D. When you have C, it is easy to draw the ABCD Pattern: (remember, the angle of the MA has to be strong) UJ today: image In case you are ...
- Bernardi replied Dec 19, 2016
Indeed, thats a bummer, everybody loves simplicity, yet, many threads end up ridiculously complicated xD Guys, for everyone who is still interested in the original Idea, this is what i have been doing for quite a long time... My Performance: 82% ...
- Friday Line Indicator
Hey Traders! Does anyone know an indicator that paints a line at the end of the Trading week, on ...
- Big Move on GBP?
Hi Every morning before i trade, i mark the high impact news on my chart to remind me not to trade ...
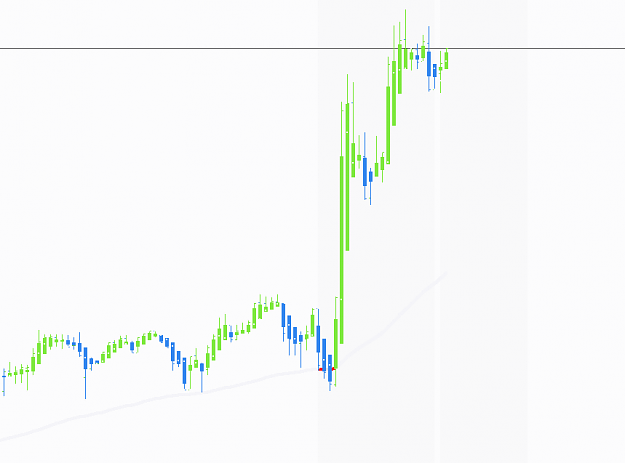
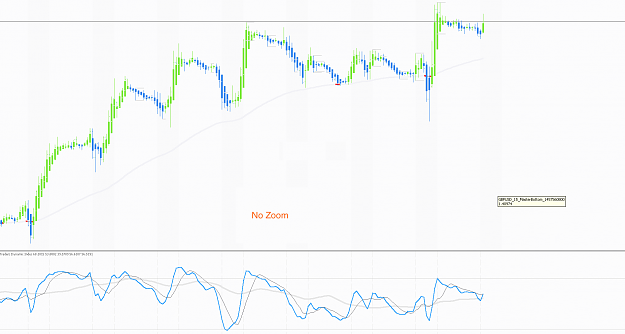
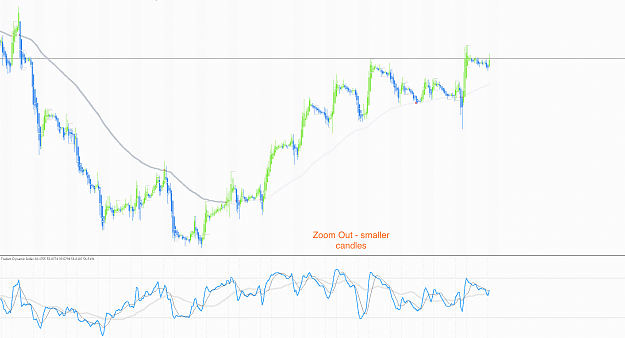
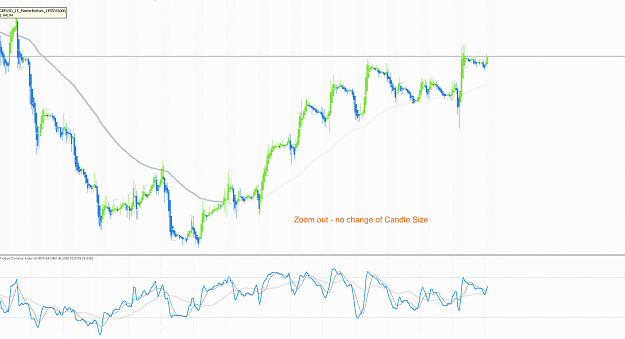
- Change the Candle Size when zooming in or out
Hi Is it possible to automatically change the APB Candle Size when i zoom out or zoom in? When i ...
- Bernardi replied Mar 11, 2016
Is it possible to automatically change the APB Candle Size when i zoom out or zoom in? When i zoom out for example, the candles are getting into each other, which looks like a mess:
- Bernardi replied Mar 10, 2016
Hi I am using a color changing EMA on my chart and i am watching it on the higher timeframes, when i trade the 1H charts, to see the prevailing trend. That is a problem when i am backtesting the 1H Charts, because i can not change to higher TFs ...
- Bernardi replied Feb 13, 2016
My chart has to be on the background, because an heiken ashi indicator is above it. and above that, is the line indicator: (the yellow lines on the Picture) I want the lines on the background, thats why i asked for an option to rearrange the ...
- Bernardi replied May 15, 2015
Very slow today, but some decent trades though: E-A: After a master candle, it did not break up very strong, the wick of the breaking candle was too big, i decided not to enter, although there was a tdi cross and a bullish trend, sadly i missed the ...
- Bernardi replied May 14, 2015
My trades today: E-A: Price bounced off a trendline, and created a bullish tdi cross, not the first candle, but volatility is rising at that time, and 4h tdi is crossing up. 20/40pips, tp at the bearish trendline, tp reached, but i missed the nice ...
- Bernardi replied May 13, 2015
All right, after some months of learning, trying, testing, practising, demoing, live trading the tms system, i finally found the way of trading, that fits to my personality and lifestyle, that means trading the 1 hour time frame whenever its ...
- Bernardi replied May 11, 2015
I was using the xadr indicator for a while now, and the color change from tradeable to untradeable is happening rarely, so i was wondering when the color change actually occurs? whats the method behind it?
- Bernardi replied May 9, 2015
I was searching a long time for an indicator, that shows me the high and the low of a candle over the heiken ashi candle, in a more simple way than setting the bar chart on the foreground, and finally i found a way It might be very helpful ...
- Bernardi replied May 8, 2015
Nice, i found something and modified it to work like i want it to, just one thing i would like to change, is it possible to change the dot to a little thin line (line shall have the width of a single candle)?