- Search Metals Mine
- 122 Results
-
 1ka replied Jul 5, 2009
Here are the cumulative trading charts for the 4H, starting from 25th May 2009. Based upon Alpari UK feed and times are shown as BST. The previous charts are here.
Inside Bar Trading Revisited
- 1ka replied Jun 7, 2009
Cumulative Charts — Here are the cumulative trading charts for the 4H, starting from 25th May 2009. Based upon Alpari UK feed and times are shown as BST. Early days, but does seem to be slightly better than the 30M charts.
Inside Bar Trading Revisited
- 1ka replied May 25, 2009
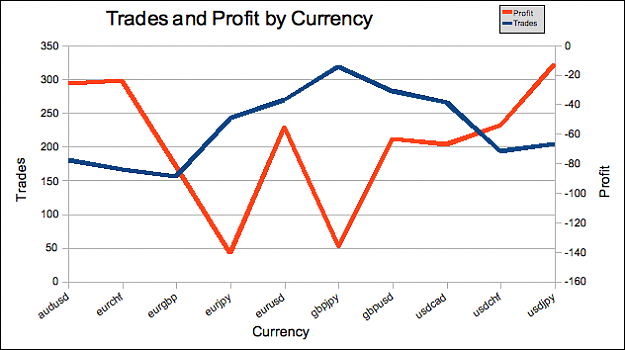
Cumulative trading charts. Previous charts are here. GBPJPY is the big loser overall. These are the last charts I'll be doing based on the 30m timeframe, at least for the time being.
Inside Bar Trading Revisited
- 1ka replied May 4, 2009
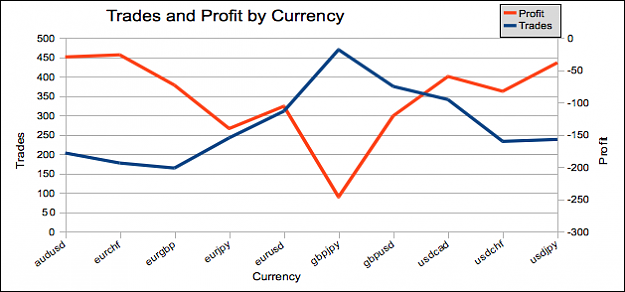
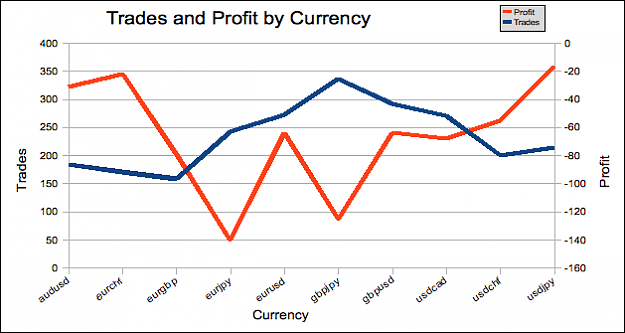
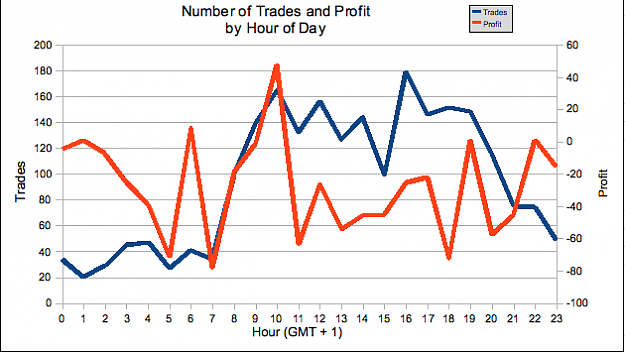
Attached are the individual currency charts showing when it's a good time to trade. Note that these results are from Alpari UK's demo feed and the hours are GMT+1 on the 30M charts using Outer bar IBs. The results date from late Jan. The EA has been ...
Inside Bar Trading Revisited
- 1ka replied May 4, 2009
Cumulative trading charts. Previous charts are here. GBPJPY is the big loser overall.
Inside Bar Trading Revisited
- 1ka replied Apr 15, 2009
Attached are the individual currency charts showing when it's a good time to trade. Note that these results are from Alpari UK's demo feed and the hours are GMT+1 on the 30M charts using Outer bar IBs. The results date from late Jan. The EA has been ...
Inside Bar Trading Revisited
- 1ka replied Apr 15, 2009
Cumulative trading charts. Last weeks charts are here. EURJPY and GBPJPY are the big losers overall. Note that 0900 GMT is still the best time to trade, but is not as profitiable as it once was. I think this is the issue we've talked about where the ...
Inside Bar Trading Revisited
- 1ka replied Apr 5, 2009
Attached are the individual currency charts showing when it's a good time to trade. Note that these results are from Alpari UK's demo feed and the hours are GMT+1 on the 30M charts using Outer bar IBs. The results date from late Jan. The EA has been ...
Inside Bar Trading Revisited
- 1ka replied Apr 5, 2009
Cumulative trading charts. Last weeks charts are here. 0900 GMT+1 still seems like a good time to trade. EURJPY and GBPJPY are the big losers overall.
Inside Bar Trading Revisited


- 1ka replied Mar 29, 2009
Attached are the individual currency charts showing when it's a good time to trade. Note that these results are from Alpari UK's demo feed and the hours are GMT+1 on the 30M charts using Outer bar IBs. The results date from late Jan. The EA has been ...
Inside Bar Trading Revisited


- 1ka replied Mar 29, 2009
Cumulative trading charts. Last weeks charts are here. 0900 GMT still seems like a good time to trade, as does 1800GMT. EURJPY still the big loser overall.
Inside Bar Trading Revisited


- 1ka replied Mar 21, 2009
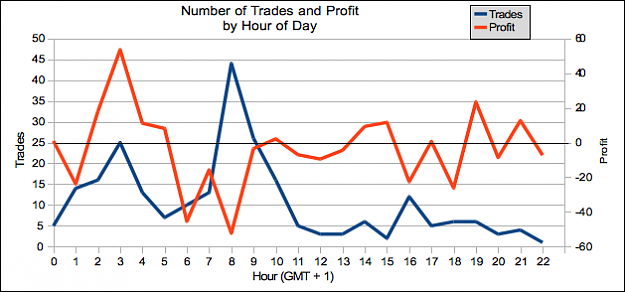
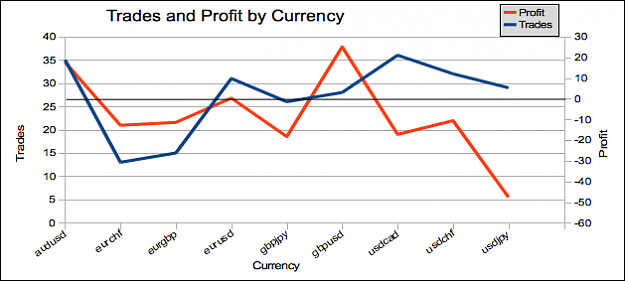
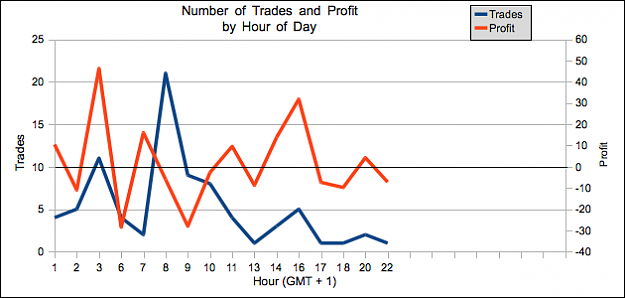
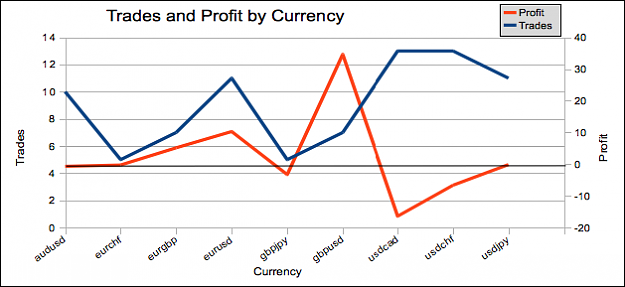
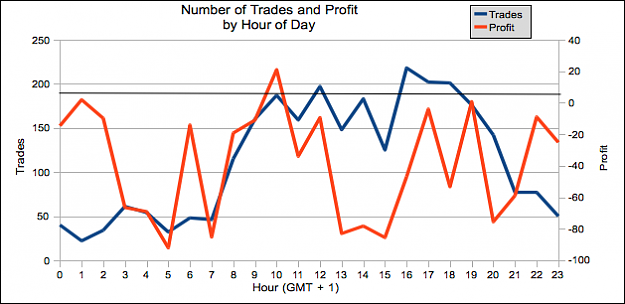
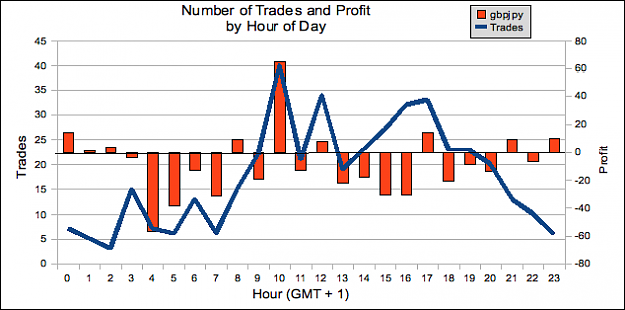
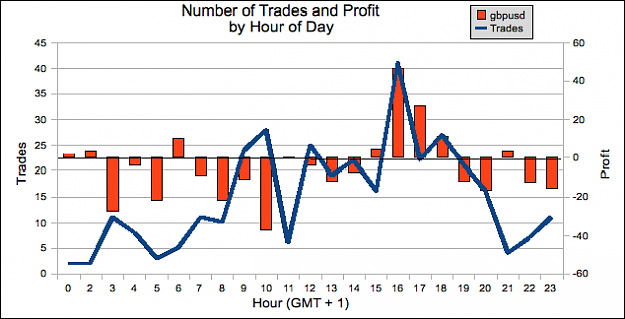
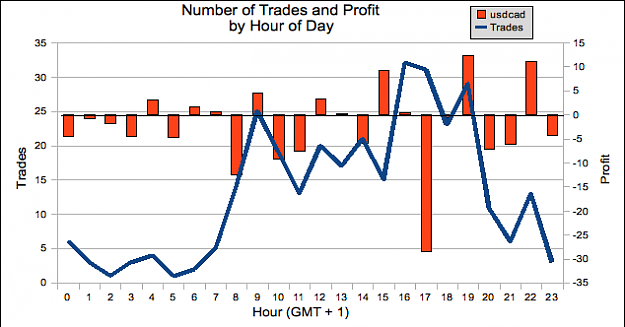
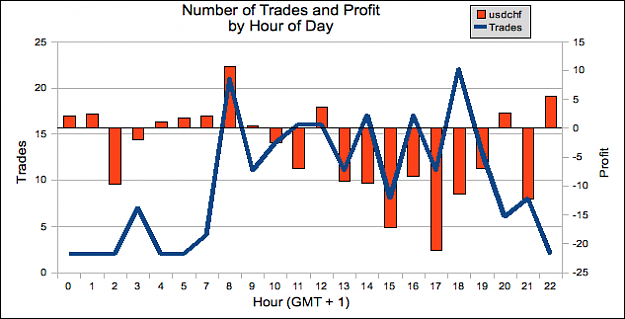
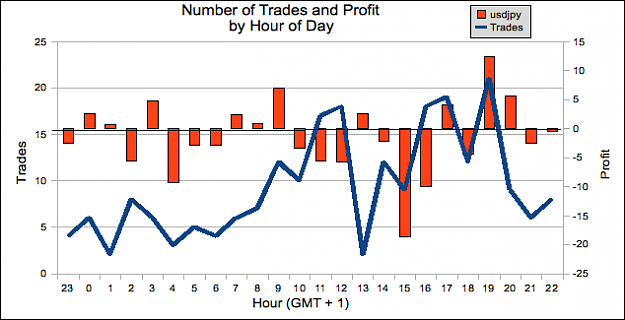
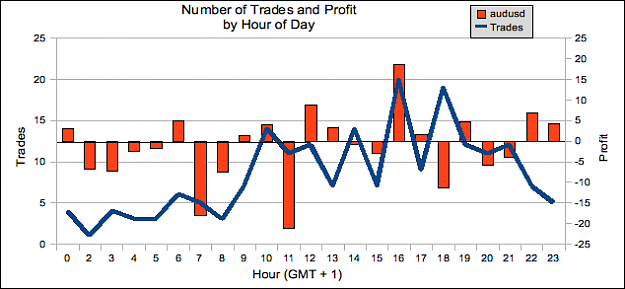
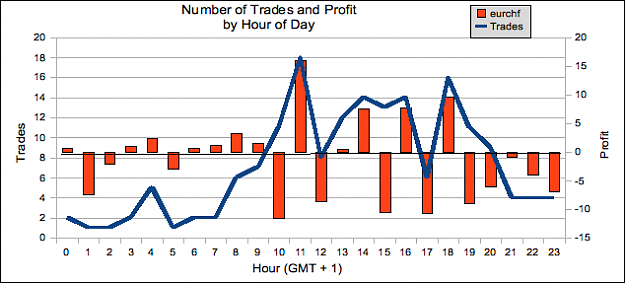
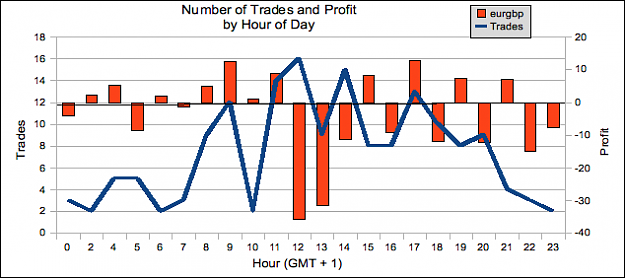
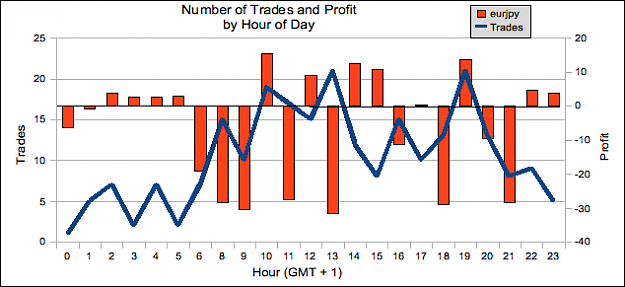
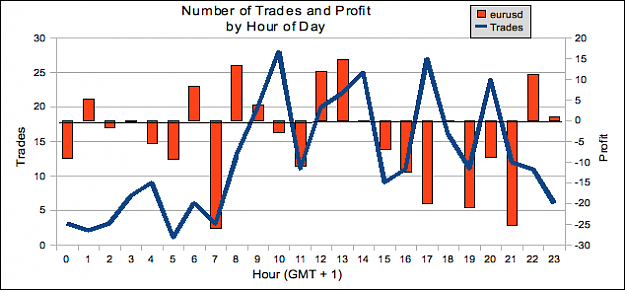
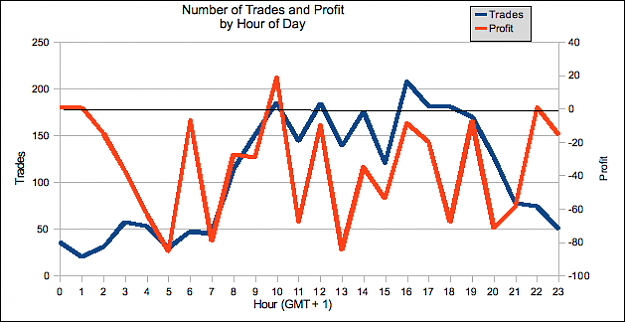
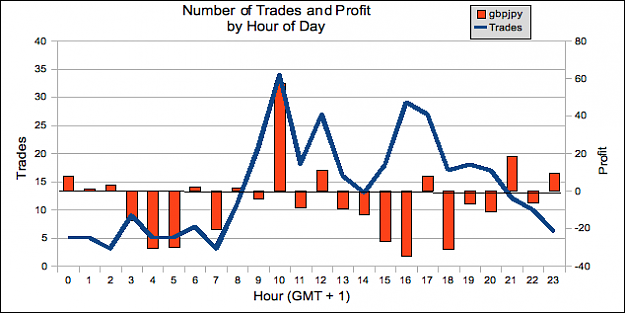
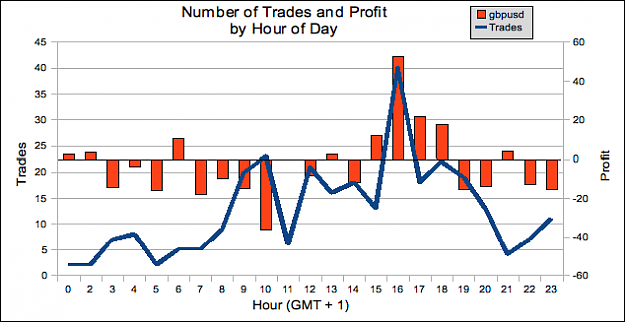
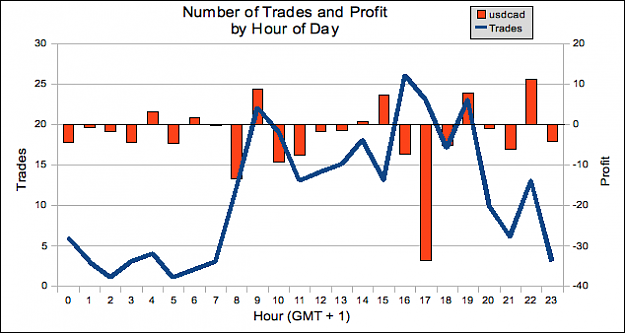
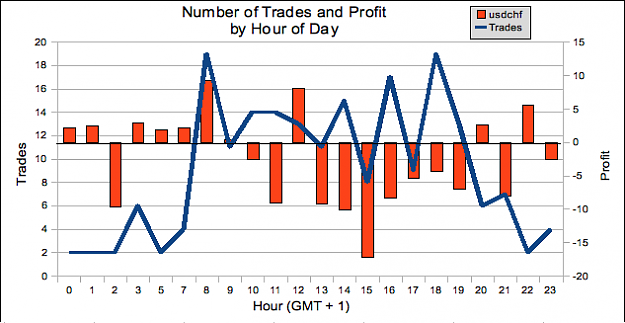
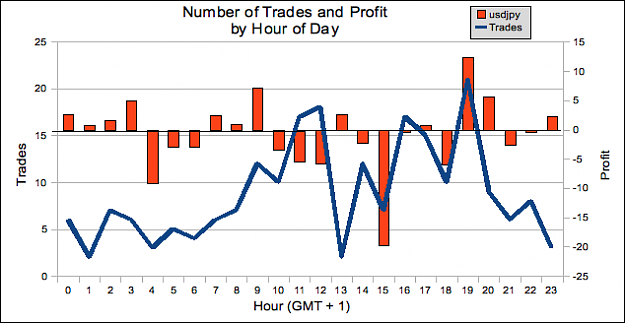
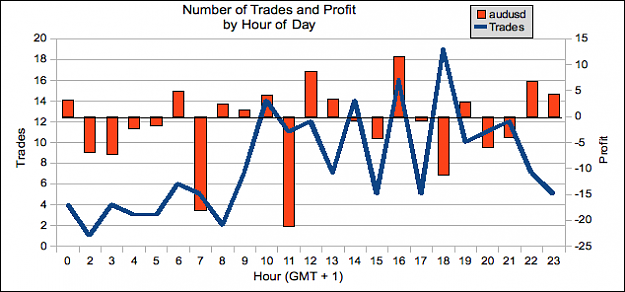
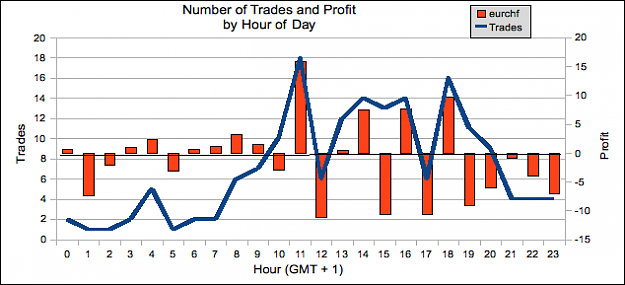
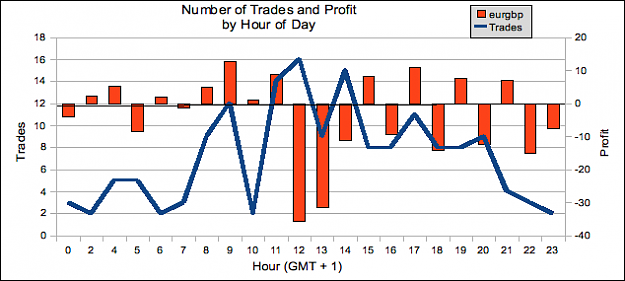
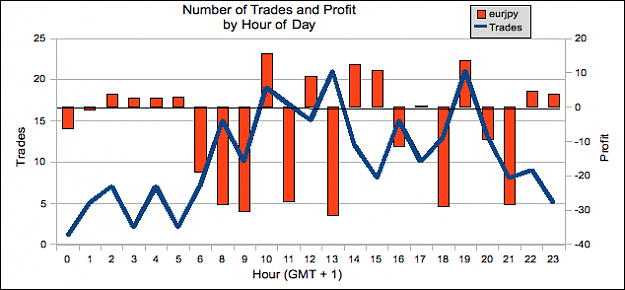
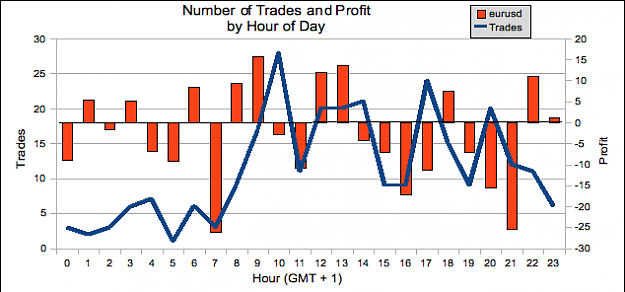
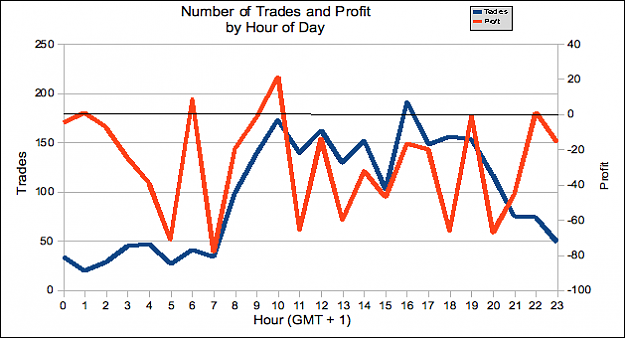
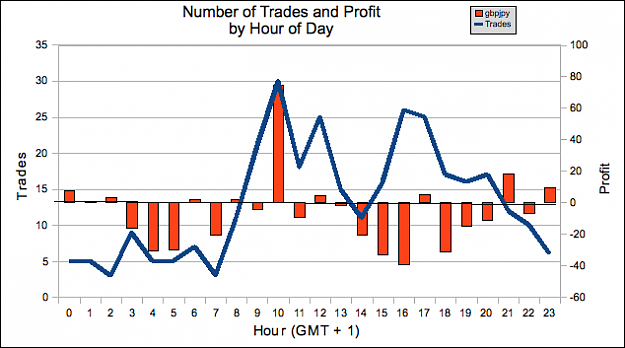
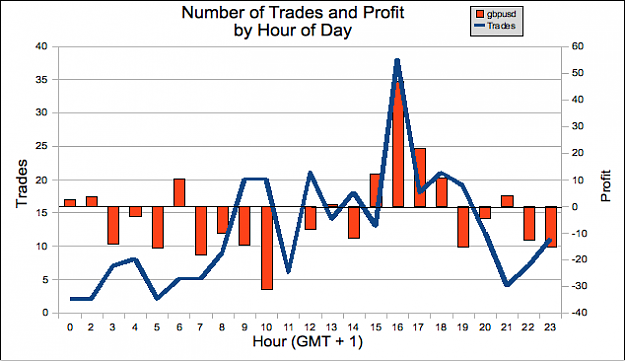
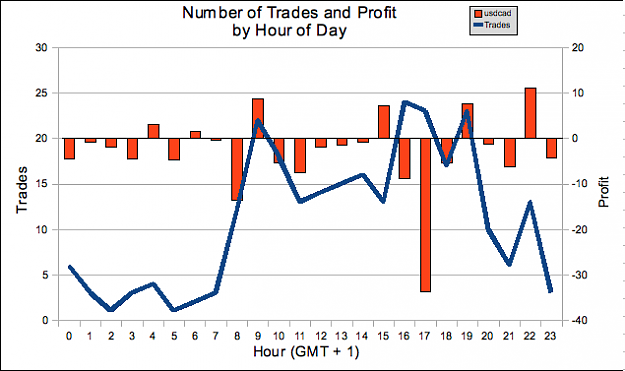
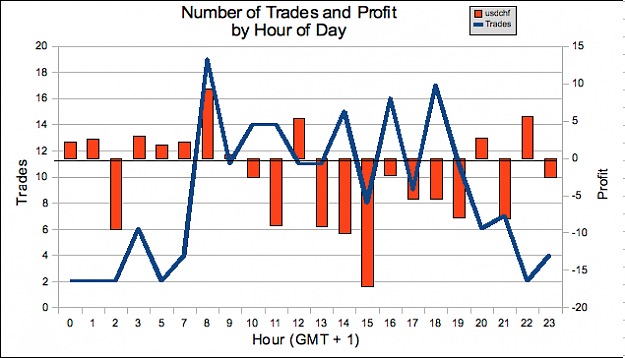
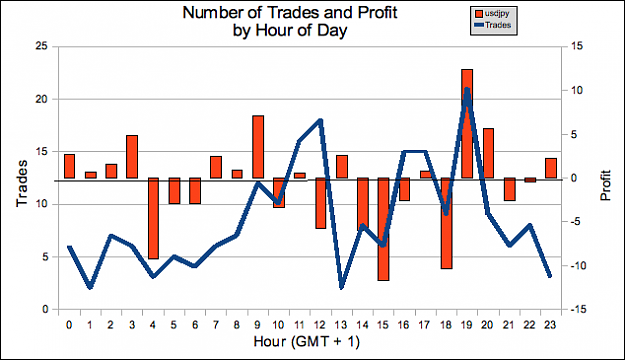
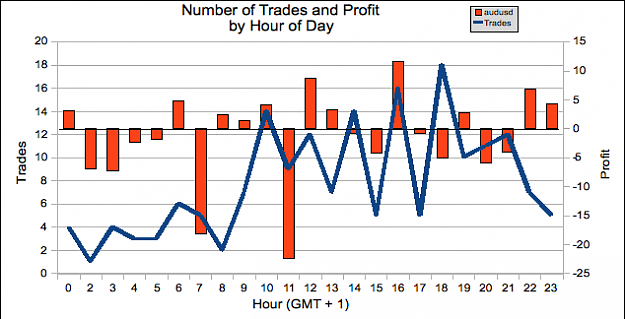
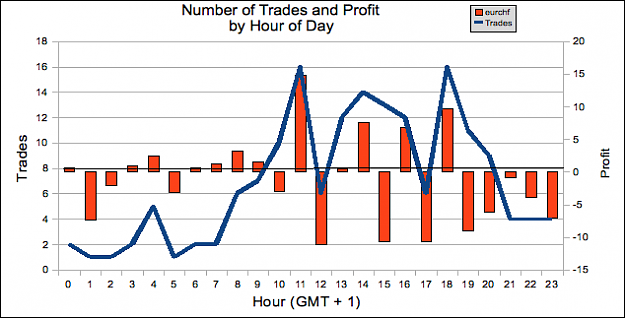
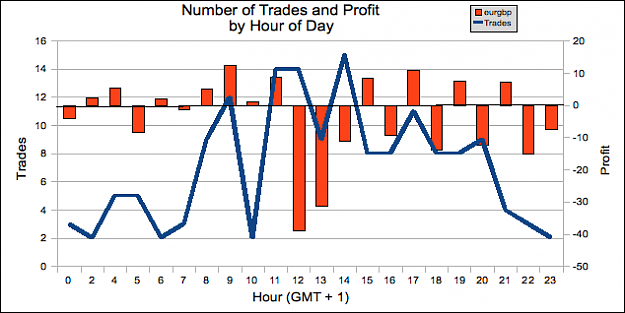
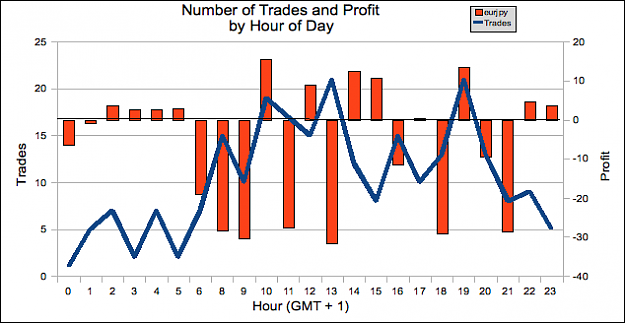
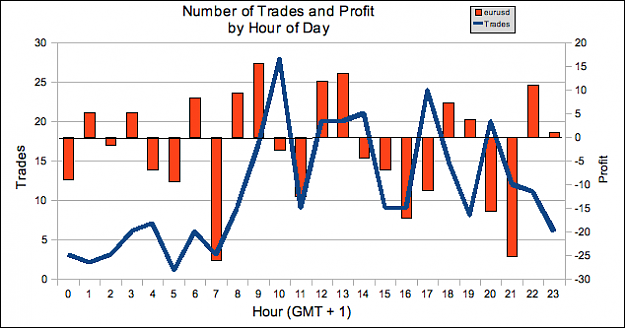
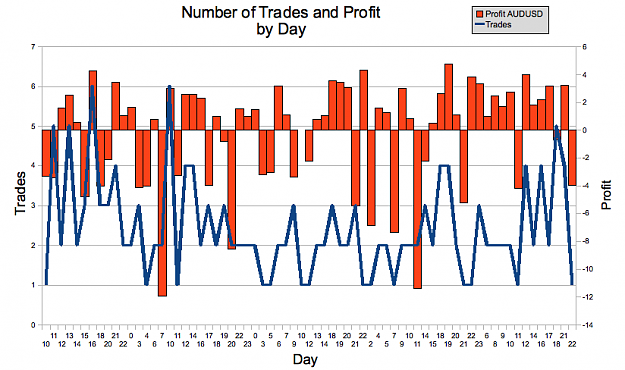
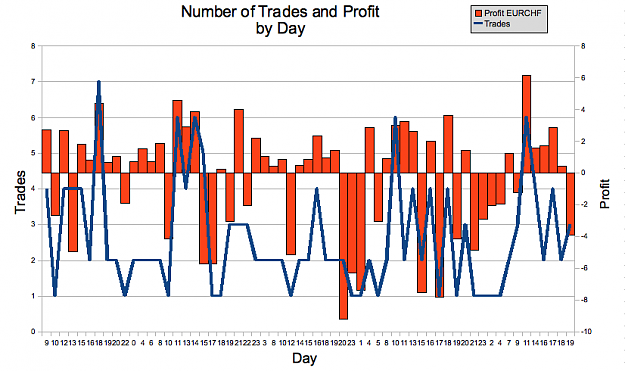
Daily/Hourly Charts for Individual Currencies — I'm contemplating changing the individual currency charts to show the daily/hourly breakdown as shown in the attached images. However, since the number of trades per hour is comparatively low, ...
Inside Bar Trading Revisited


- 1ka replied Mar 21, 2009
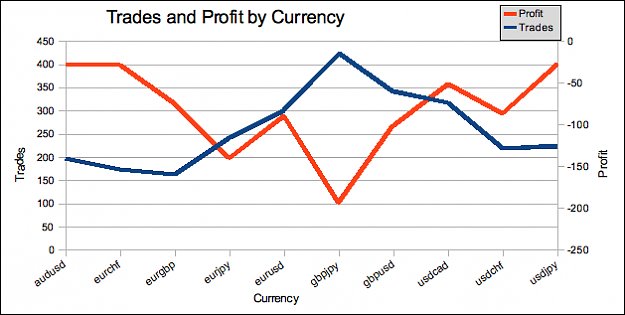
Attached are the individual currency charts showing when it's a good time to trade. Note that these results are from Alpari UK's demo feed and the hours are GMT+1 on the 30M charts using Outer bar IBs. The results date from late Jan. The EA has been ...
Inside Bar Trading Revisited


- 1ka replied Mar 21, 2009
Cumulative trading charts. Last weeks charts are here. 0900 GMT still seems like a good time to trade, as does 1800GMT. EURJPY still the big loser overall. Note that I've stopped posting the daily charts. Since the EA is running without any ...
Inside Bar Trading Revisited


