- Search Metals Mine
- 686 Results (21 Threads , 665 Replies )
-
 Master-Mind replied Oct 4, 2019
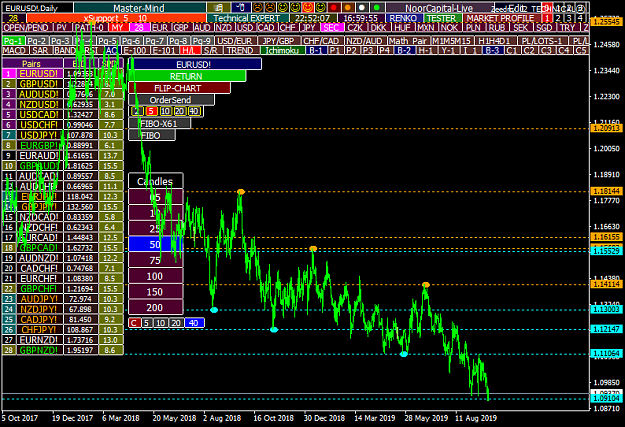
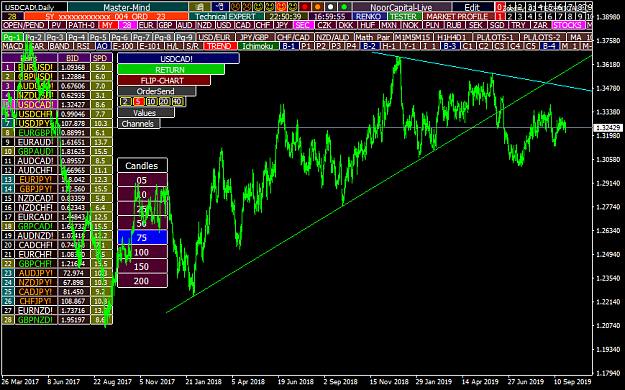
another subtitle: "P2" What is the candles shape of all famous 28 pairs for the last week? in less than one second you can look and compare! "last-candle" for all pairs are shown on single chart!
Full explanation of "technical analysis expert"
- Master-Mind replied Oct 4, 2019
and in the same manner for trends/channesl this is just a sample explanation of 0.47% of this expert ! all is done(generated) automatically in less than 1 seconds or more than 100 pairs(instruments) our math slogan : 1 year = 1 second
Full explanation of "technical analysis expert"
- Master-Mind replied Oct 4, 2019
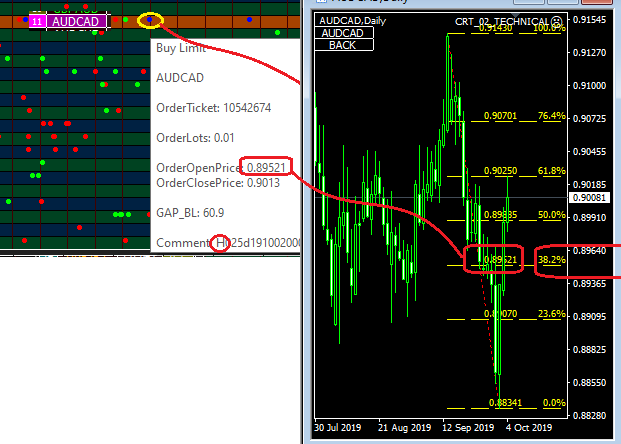
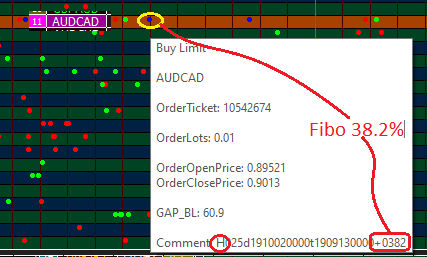
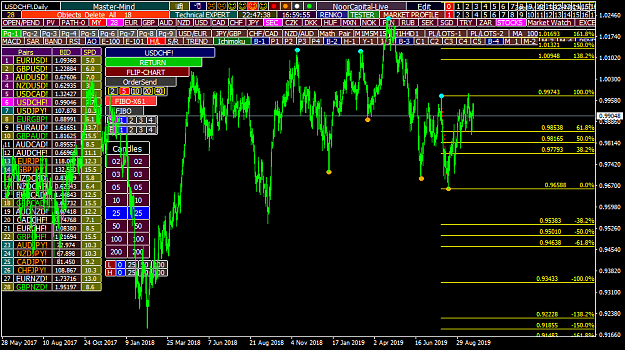
and the distance from current price is about 60 pips--look at previous picture (either x-axis or detail window box) if we click on blue circle, Fibo will generated automatically. everything else will disappear and you retain! all of that is done in ...
Full explanation of "technical analysis expert"
- Master-Mind replied Oct 4, 2019
FIBO---blue circles H: drop from high to low L: jump from low to high
Full explanation of "technical analysis expert"
- Master-Mind replied Oct 4, 2019
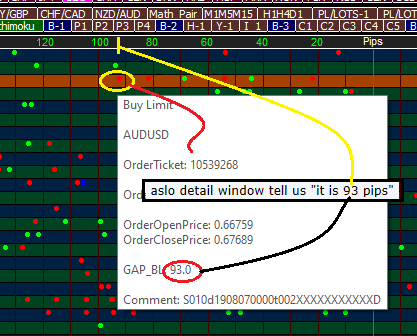
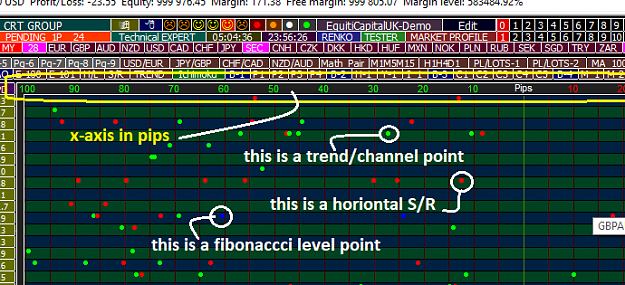
from just on look, you know from x-axis "pips-axis" that this point is far away by 93!! do not think too much!
Full explanation of "technical analysis expert"
- Master-Mind replied Oct 4, 2019
more to say on picture: 93 pips is the difference in pips b/w current price and the support value. aslo detail window tell us "it is 93 pips"
Full explanation of "technical analysis expert"
- Master-Mind replied Oct 4, 2019
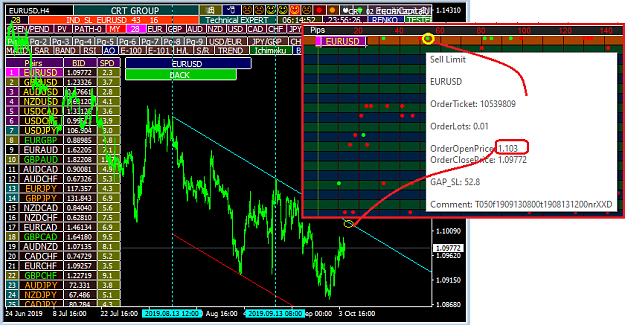
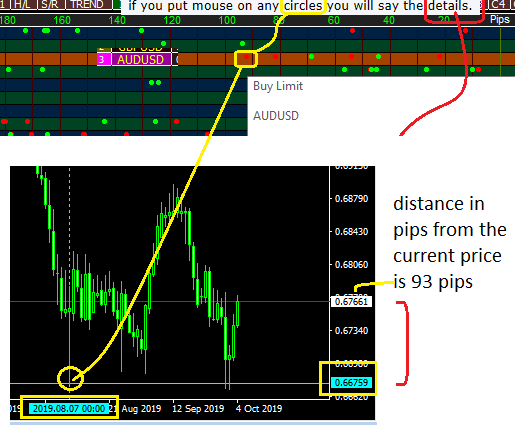
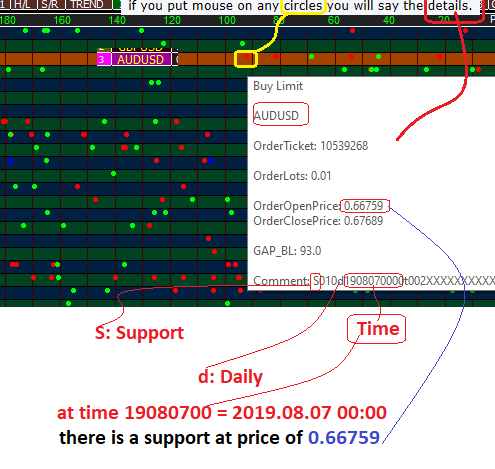
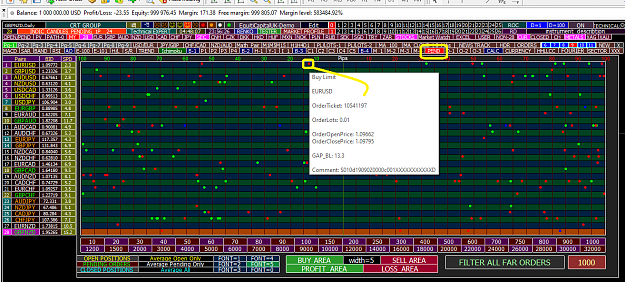
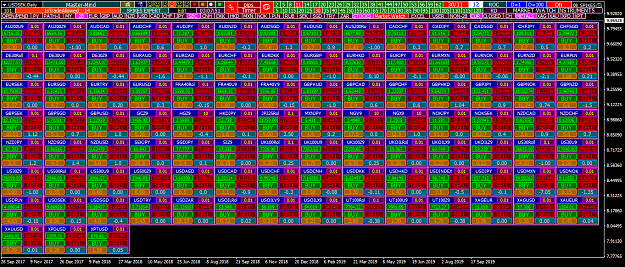
look! in our favour! so "PEND" just in 1 second for more than 100 instrument, gives all technical values. for picture below, we don't open AUDUSD CHART and we do not put vertical and horizonal aqua lines manually! we just click on the red circle, ...
Full explanation of "technical analysis expert"
- Master-Mind replied Oct 4, 2019
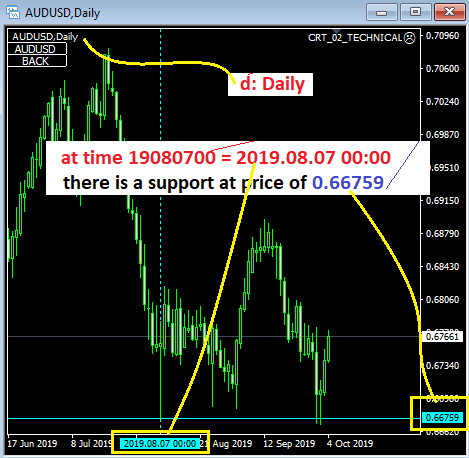
as you see on picture: the is a support (absolute low or trough) at 2019.08.07 00:00 on AUDUSD at 0.66759 on Daily frame. is it correct??? true AUDUSD chart is the "referee"
Full explanation of "technical analysis expert"
- Master-Mind replied Oct 4, 2019
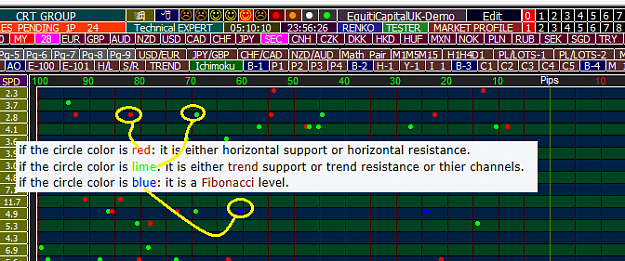
"PEND" the x-axis, is distance in pips. the y-axis is the pairs list(many arrangements) each small circle represent a technical point on the chart. if the circle color is red: it is either horizontal support or horizontal resistance. if the circle ...
Full explanation of "technical analysis expert"
- Master-Mind replied Oct 4, 2019
"PEND" subtitle is simply dictated to "classical analysis" Classical analysis is: 1) horizontal support and resistance(peaks and troughs) 2) Trends and channels 3) Fibonacci % levels we see content below when we click on "PEND" -- its square will be ...
Full explanation of "technical analysis expert"
- Master-Mind replied Oct 4, 2019
When we click on the title square, we say all of this expert subtitles (tens of indicators and study tools)
Full explanation of "technical analysis expert"
- Full explanation of "technical analysis expert"Started Oct 4, 2019|Recycle Bin|13 replies

Designed by: CRT TECHNICAL GROUP(SUBISDARY OF AL-BEDWEIWI GROUP) JEDDAH, SAUDI ARABIA. Monopoly ...
- Master-Mind replied Oct 1, 2019
SPIKES SOUNDS HAVE BEEN INCLUDED When some pair jumps to predefined pips(say 11 pips) within selected time (say 57 seconds), you will be alerted through specific short song(of period 7 seconds)
"Mahal Expert": each currency pairs Candles
- Master-Mind replied Sep 28, 2019
Horizontal supports and resistance are included
"Mahal Expert": each currency pairs Candles
- Master-Mind replied Sep 28, 2019
Now it is a different story! Fibo Included
"Mahal Expert": each currency pairs Candles
- Master-Mind replied Dec 5, 2018
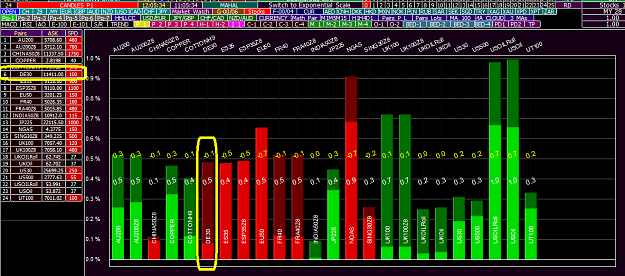
status of all 96 instrument that my broker provides, at a glance, what ever the number of instruments! either 28 or 96 or even 11000,-- at one second you know the status of all! no limit for genius no limit for superiority I can explain live as: ...
"Mahal Expert": each currency pairs Candles
- Master-Mind replied Dec 5, 2018
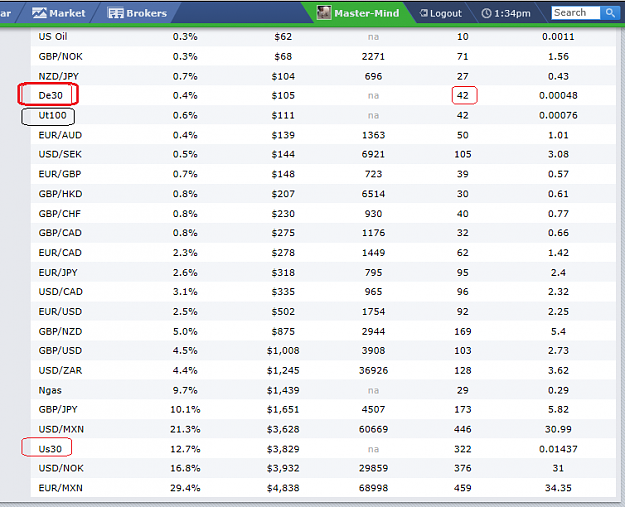
include anything available with ur broker regarding de30--myself traded this week 40 times on my account live.
"Mahal Expert": each currency pairs Candles
- Master-Mind replied Dec 4, 2018
do you mean by DAX, de30??
"Mahal Expert": each currency pairs Candles