-
Natural Gas Price Analysis for April 17, 2024
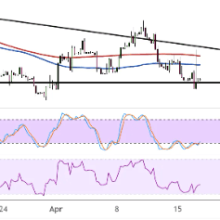
Natural gas formed lower highs and found support at the $1.650 level, creating a descending triangle pattern on its hourly time frame. Price is testing support and could be due for another bounce to the top. The 100 SMA is below the 200 SMA, though, so the path of least resistance is to the downside. In other words, support is more likely to break than to hold, possibly leading to a selloff that’s the same height as the chart formation. However, stochastic has been indicating oversold conditions for quite some time, so pulling higher would mean that buyers are returning and could take natural gas up to the triangle ... (full story)
- Comments
- Subscribe
-
- Older Stories
 From imf.org|Apr 17, 2024
A sense of optimism has pervaded financial markets in recent months, amid investor confidence that the fight against inflation is entering its “last mile” and that central banks ...
 From offshore-technology.com|Apr 17, 2024
The US Government will not renew a temporary licence for Venezuela’s oil and gas sector unless the country’s President Nicolas Maduro commits to free and fair elections this year, ...
 From asiatimes.com|Apr 17, 2024
In the second half of the 20th century, scholars and macrohistorians like Alvin Toffler, Francis Fukuyama and Paul Kennedy developed so-called grand narratives to predict future ...
-
- Newer Stories
 From cnbc.com|Apr 17, 2024
Superyachts sales took a dive in 2023, as long waiting lists, soaring costs and oligarch sanctions hit demand, according to a new report. Sales of new superyachts (yachts over 100 ...
 From rystadenergy.com|Apr 17, 2024
Liquefied natural gas (LNG) remains the fuel of choice for lower-carbon shipping, despite the rise in orders for vessels equipped with dual-fuel methanol and ammonia engines, ...
 From forexlive.com|Apr 17, 2024
The recent price action in Crude Oil indicates that the market needs some rest as we haven’t seen a sustained rally despite the big geopolitical risk in the Middle East between ...
- Story Stats
- Posted: Apr 17, 2024 6:52am
- Submitted by:Category: Technical AnalysisComments: 0 / Views: 109