-
Gold Price Chart Posts Bullish "Golden Cross" Formation, Will it Rally?
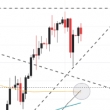
Gold prices may continue to rise after the precious metal posted a bullish moving average crossover on the daily chart early this week. The “golden cross” formation occurs when a shorter-term moving average overtakes a longer-term moving average and many traders take the crossover as a hint that further gains could be in store. In the case of the gold price chart, the 50-day simple moving average has overtaken the 200-day simple moving average around the $1828 price point and may equip gold with the bullish sentiment required to push higher. chart That said, there are hurdles to be negotiated and an early ... (full story)
- Story Stats
- Posted: Jun 9, 2021 5:27pm
- Submitted by:Category: Technical AnalysisComments: 0 / Views: 284