RANGE 1700.00 - 1730.00
Support Resistance Level
1 1680.00 1740.00 target 1
2 1660.00 1760.00
INDICATOR VALUE STOCH (14) ↓ 8
RSI (14) ↓ 35
MACD (9) -5 ↓
PAR SAR (9) ↓ 1760
EMA (20) ↓ 1741
EMA (50) ↓ 1721
Stagnation after the sharp fall in the previous period,
which is the accumulation of successive correction since
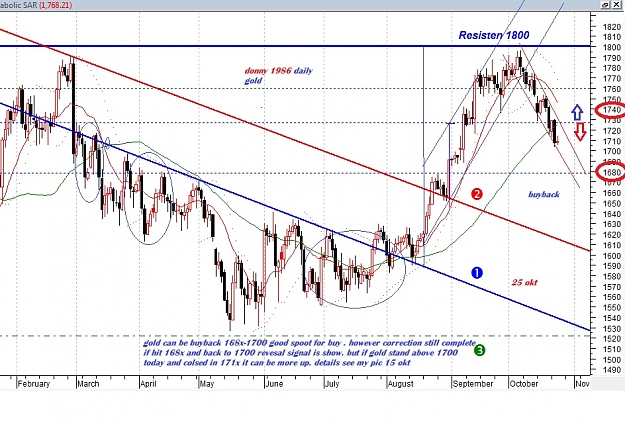
gold rally unstoppable at important resistance at 1800. so that
given the bearish picture is still quite strong, target support 1700
and 1680 remain open despite the gold at the end of this week will move flat, but weak (lower flat).
Can be expected that gold is trying to emulate
pattern that occurred during the period of November 2011 and February
then, in which both patterns are equally targets
minimum reduction to the 1680's. Although it was marred
swing into the 1730's, but that did not last long.
rebound today but still have correction. if gold can be above 1715 signal up R2. signal down below 1697
becarefull smart trading3
All the charts and analysis provide here is not recommended for trading purpose. Trade at your own risk. I provide knowledge not direction. I hold no liability for your trades and decision. thank's
RANGE 1700.00 - 1730.00
Support Resistance Level 1 1680.00 1740.00 TARGET 1
2 1660.00 1760.00
INDICATOR VALUE
STOCH (14) ↑ 10 UP
RSI (14) ↓ 7 DOWN
MACD (9) -7 ↓
PAR SAR (9) 1752.41 ↓
EMA (20) ↓ 1735.88
EMA (50) 1729.10 ↑
ATTENTION In the period after the period in the past week gold
likely to continue to pressure. A number of reinforcement
repeatedly demonstrated frequent loss of momentum and turned
be negative. As in the previous outlook that exposure
predicted to reach the golden 1700s eventually
been fulfilled. Thus, just one more support
likely to be achieved as well, namely 1680. Why is that? this
based on the pattern that occurred in the period November 2011
or February, at which time reduction
minimum achievement towards 1680. And would indicate
signs of recovery or even sideways post TSB levels are met.
In addition to the relatively light trading volume, the gold market
Sandy largely ignored storm that is expected to
disastrous impacts for the 50 million people of the Mid Atlantic
up to Canada on a path.
gold for
traded in a narrow range due to uncertainty ahead
Non-farm payroll data (non-farm payrolls), U.S.. The Fed has
explicitly maintain bond purchase program
mortgage-based labor market to recover.
The U.S. Labor Department said on Monday
that will release employment data on Friday which now
may be delayed because of a storm that hit the U.S..
technical
30 okt 2012 daily gold donny 1986
RANGE 1700.00 - 1730.00
Support Resistance Level
1 1680.00 1740.00
2 1660.00 1760.00
INDICATOR VALUE
STOCH (14) ↑ 16
RSI (14) ↓ 39
MACD (9) -8 ↓
PAR SAR (9) ↓ 1737
EMA (20) ↓ 1733
EMA (50) ↓ 1720
There is no positive indication that dominant in initiating
This week, gold looks still filled with atmosphere
bearish, although not accompanied by break-low. and
some gain also often lose momentum and
bhakan become stagnant or negative. staying single
support more likely possibility is also that
position 1680. This target is based on a pattern that occurs in
November 2011 or February period ago that gold
the opportunity to improve it to the level of 1680
first.
Saham-saham Jepang turun untuk ketiga kalinya setelah Bank of Japan (BOJ) hari ini memperluas program pembelian asset menjadi 66 trilyun yen ($830 milyar) dan yen naik terhadap dollar dan euro.
Index 225 Stock Average turun sebesar 1 persen ke 8841.98 pada penutupan perdagangan di Tokyo, membalikan gain sebanyak 0.7 persen sebelumnya setelah bank sentral Jepang memperluas dana pembelian asset senilai 11 trilyun yen. Volume pada index lebih dari 15 persen diatas rata-rata 30-hari. Index Topix turun 0.9% ke 733.46.
�Sebagian besar telah memprediksi dan menyerap kedalam harga pada kelanjutan pelonggaran saat ini. Investor menjual untuk mengunci keuntungan pasca pengumuman, belajar dari pengalaman bulan September, ketika reli berlangsung hanya sesaat,� kata Soichiro Monji, kepala strategist dari Daiwa SB Investment Ltd.
26 dari 27 ekonom yang disurvey Bloomber News telah memprediksi adanya pelonggaran, dengan sebagian besar memperkirakan adanya ekspansi dana senilai 10 trilyun yen. Bank sentral tersebut melonggarkan kebijakan sebelumnya pada 19 September, ketika mengejutkan pasar dengan memperluas dana pembelian asset senilai 10 trilyun yen.
Index Topix naik 2 persen sejak September 6 setelah Bank Sentral Eropa memulai gelombang global pelonggaran kebijakan moneter untuk mendorong pertumbuhan, dengan diikuti oleh Federal Reserve AS dan Bank of Japan berikut.
Futures pada S & P 500 turun 0,6 persen di New York. Perdagangan ekuitas AS dihentikan untuk hari kedua karena Badai Sandy yang melanda Pantai Timur Amerika. Bursa saham AS berencana untuk membuka kembali perdagangannya besok bila cuaca memungkinkan, menurut laporan dari NYSE Euronext dan Nasdaq OMX Group Inc.
Nissan Motor Co, turun 2,5 persen setelah naik sebanyak 0,8% sebelumnya. Fujikura Ltd tenggelam 4,6% setelah memangkas setengah dari proyeksi keuntungannya. Sharp Corp melonjak 6,2% pada laporan bahwa perusahaan itu sedang dalam pembicaraan investasi dengan Apple, Google dan Microsoft.
CORNER ANALYSIS
1700.00 - 1730.00
S1
1704.53
Support
1680.00
1660.00
Pivot Point
1709.87
Medium Neutral
Resistance
1740.00
1760.00
R1 R2
1715,13 1720,47
Still seen stagnation in the session yesterday, although positive is also relatively limited, in the middle of the visible gold is still filled with the atmosphere bearish, although not accompanied by break-low. Some gains are also often lose momentum and not able to last long enough. Opportunities to support 1680 may still be open. This target is based on a pattern that occurred during the period of November 2011 or February and that golden opportunity to fine-tune it to the 1680 level first. But if there is penetration resistant, 1730, min today, could be strengthen reversal.
INDICATOR
STOCH (14) RSI (14)
VAL UE
↓ 15
↓ 39 MACD (9) -9 ↓
PAR SAR (9) EMA (20) EMA (50)
↓ 1732 ↓ 1731 ↓ 1720
CORNER ANALYSIS
1700.00 - 1730.00
S1
1710.93
Support
1680.00
1660.00
Pivot Point
1718.47
Medium Neutral
Resistance
1740.00
1760.00
R1 R2
1728,03 1735,57
Long
Bullish
Gold tried to approach the 1730 resistance, but not followed by penetration (break-out) so do not be appearing reversal, especially amid positive sentiment is still minimal. It remains to be seen if this happens break-session low. Some gains are also often lose momentum and not able to last long enough. Opportunities to support 1680 may still exist, based on the pattern that occurred during the period of November 2011 or February ago that gold had the opportunity to improve it to the level of 1680 first.
INDICATOR
STOCH (14) RSI (14)
↑
VAL UE
20 45 -8 1727 1730 1720
↑ MACD (9) ↑
PAR SAR (9) EMA (20) EMA (50)
↓ ↓ ↓
Gold tried to approach the 1730 resistance, but not followed by penetration (break-out) so do not be appearing reversal, especially amid positive sentiment is still minimal. It remains to be seen if this happens break-session low. Some gains are also often lose momentum and not able to last long enough. Opportunities to support 1680 may still exist, based on the pattern that occurred during the period of November 2011 or February ago that gold had the opportunity to improve it to the level of 1680 first.
RANGE Level 1
2
S2
1643.80
Short
Bearish
1660.00 - 1680.00
S1
1660.60
Support
1640.00 1620.00
Pivot Point
1688.75
Medium
Neutral
Resistance
1700.00
1720.00
R1 R2
1705.55 1733.70
Long
Bullish
Gold unexpectedly showed the worst performance in at least the last 2 months. This sharp decline in a technical correction will confirm further, at least break back in 1680, that support the targeted reduction in support in 1730 when gold exceeded pertengaham October.
It can be assumed that the pattern seen in the period November 2011 and February 2012 is relevant to help predict the next movement of gold. From 2 pattern, while gold break 1680 again, the strong bearish.
INDICATOR
STOCH (14)
RSI (14)
VAL UE
↓ 19 ↓ 31
MACD (9) -11 ↓
PAR SAR (9)
EMA (20)
EMA (50)
↓ ↓ 1727.00 1717.61 1734.78 ↑
CORNER ANALYSIS
1720.00 - 1750.00
S1
1701.59
Support
1700.00
1680.00
Pivot Point
1716.72
Medium Neutral
Resistance
1760.00
1780.00
R1 R2
1730,94 1746,07
Long
Bullish
Gold begins to show up a pretty impressive though gold market sentiment amid a wait-and-see and tend to be careful. When considered more carefully, gold is expected to match the pattern as it did in the period of early September 1730 during which the resistant penetrate. So technically if the level is penetrated, morbidly's 1760 rule immediately achieved.
In addition, the pattern of the period November 2011 and February 2012 gold is still likely to show positive potential. Gradually the resistance is likely to be achieved in 1730's and 1760's.
INDICATOR
STOCH (14) ↑ RSI (14) ↓
VAL UE
42
47 MACD (9) -10 ↓
PAR SAR (9) EMA (20) EMA (50)
1672 ↑ ↑ ↑ 1719 1717