- Silver rises 1.32% to $28.57, buoyed by lower US Treasury yields and a weakening dollar.
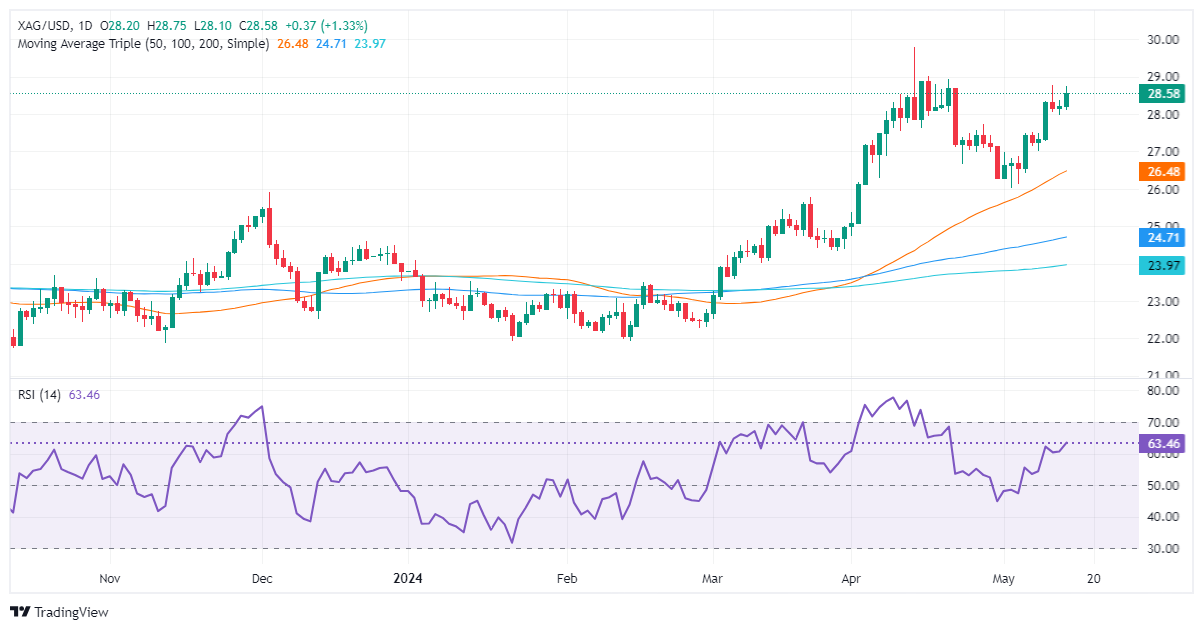
- XAG/USD shows strong upward trend within $28.00-$28.80 range, up from early May low of $26.02.
- To maintain momentum, silver aims to breach $29.00, targeting YTD high of $29.79 and $30.00.
- Support at $28.00; further supports at 38.2% Fib retracement ($27.70) and 50% Fib ($27.06).
Silver's price moved higher late in the North American session due to lower US Treasury yields and a softer US Dollar. Although the latest inflation figures in the US were higher than expected, the non-yielding metal climbed. The XAG/USD trades at $28.57, gains 1.32%.
XAG/USD Price Analysis: Technical outlook
During the last three days, Silver has been seesawing within the $28.00-$28.80 range after registering exponential gains since May 2, which brought the grey metal’s price from around $26.02 to current spot prices.
XAG/USD is upward biased, though is at the brisk of forming a ‘double top.’ Momentum favors buyers, with the Relative Strength Index (RSI) standing at bullish territory.
For a bullish continuation, buyers need to reclaim the $29.00 psychological figure. Once cleared, the next stop would be the year-to-date (YTD) high at $29.79, followed by the $30.00 mark.
Conversely, if sellers stepped in and pushed prices below $28.00, look for further losses. The first demand zone would be the 38.2% Fib retracement at $27.70. A breach of the latter will expose the 50% Fib retracement at $27.06.
XAG/USD Price Action – Daily Chart
Information on these pages contains forward-looking statements that involve risks and uncertainties. Markets and instruments profiled on this page are for informational purposes only and should not in any way come across as a recommendation to buy or sell in these assets. You should do your own thorough research before making any investment decisions. FXStreet does not in any way guarantee that this information is free from mistakes, errors, or material misstatements. It also does not guarantee that this information is of a timely nature. Investing in Open Markets involves a great deal of risk, including the loss of all or a portion of your investment, as well as emotional distress. All risks, losses and costs associated with investing, including total loss of principal, are your responsibility. The views and opinions expressed in this article are those of the authors and do not necessarily reflect the official policy or position of FXStreet nor its advertisers. The author will not be held responsible for information that is found at the end of links posted on this page.
If not otherwise explicitly mentioned in the body of the article, at the time of writing, the author has no position in any stock mentioned in this article and no business relationship with any company mentioned. The author has not received compensation for writing this article, other than from FXStreet.
FXStreet and the author do not provide personalized recommendations. The author makes no representations as to the accuracy, completeness, or suitability of this information. FXStreet and the author will not be liable for any errors, omissions or any losses, injuries or damages arising from this information and its display or use. Errors and omissions excepted.
The author and FXStreet are not registered investment advisors and nothing in this article is intended to be investment advice.
Recommended content
Editors’ Picks
EUR/USD plummets to weekly lows near 1.0800 after US jobs data

EUR/USD stays under heavy pressure and trades at its lowest level in a week near 1.0800. The US Dollar continues to gather strength following the upbeat jobs data, which showed an increase of 272,000 in Nonfarm Payrolls in May, and weighs on the pair.
GBP/USD slumps below 1.2750 after encouraging US Payrolls

GBP/USD stays on the back foot and trades deep in negative territory below 1.2750 in the American session. The US Dollar outperforms its rivals following the impressive labor market data for May, forcing the pair to stretch lower heading into the weekend.
Gold falls toward $2,300 as US yields rally

Gold turned south and dropped below $2,320, erasing all of its weekly gains in the process. The benchmark 10-year US Treasury bond yield is up more than 3% on the day above 4.4% after strong US Nonfarm Payrolls data, dragging XAU/USD lower.
Bonk price approaches key reversal zone, 28% bounce likely

Bonk price crashed 30% from its recent peak and is gravitating towards a critical support zone. This correction presents a potential buying opportunity for investors anticipating a rebound and subsequent upward trend continuation for the meme coin.
GameStop stock gets slammed by early earnings release, 75 million share sale Premium

GameStop (GME) has once again rained on Keith Gill’s parade as executives disclosed a plan to sell as many as 75 million shares of the stock in at-the-market prices.