
Advertisement
Advertisement
Gold Price Forecast: Eyes Further Upside Potential
By:
Gold is set to end the week on a strong note, reaching a new short-term high after a rebound from a test of support.
In this article:
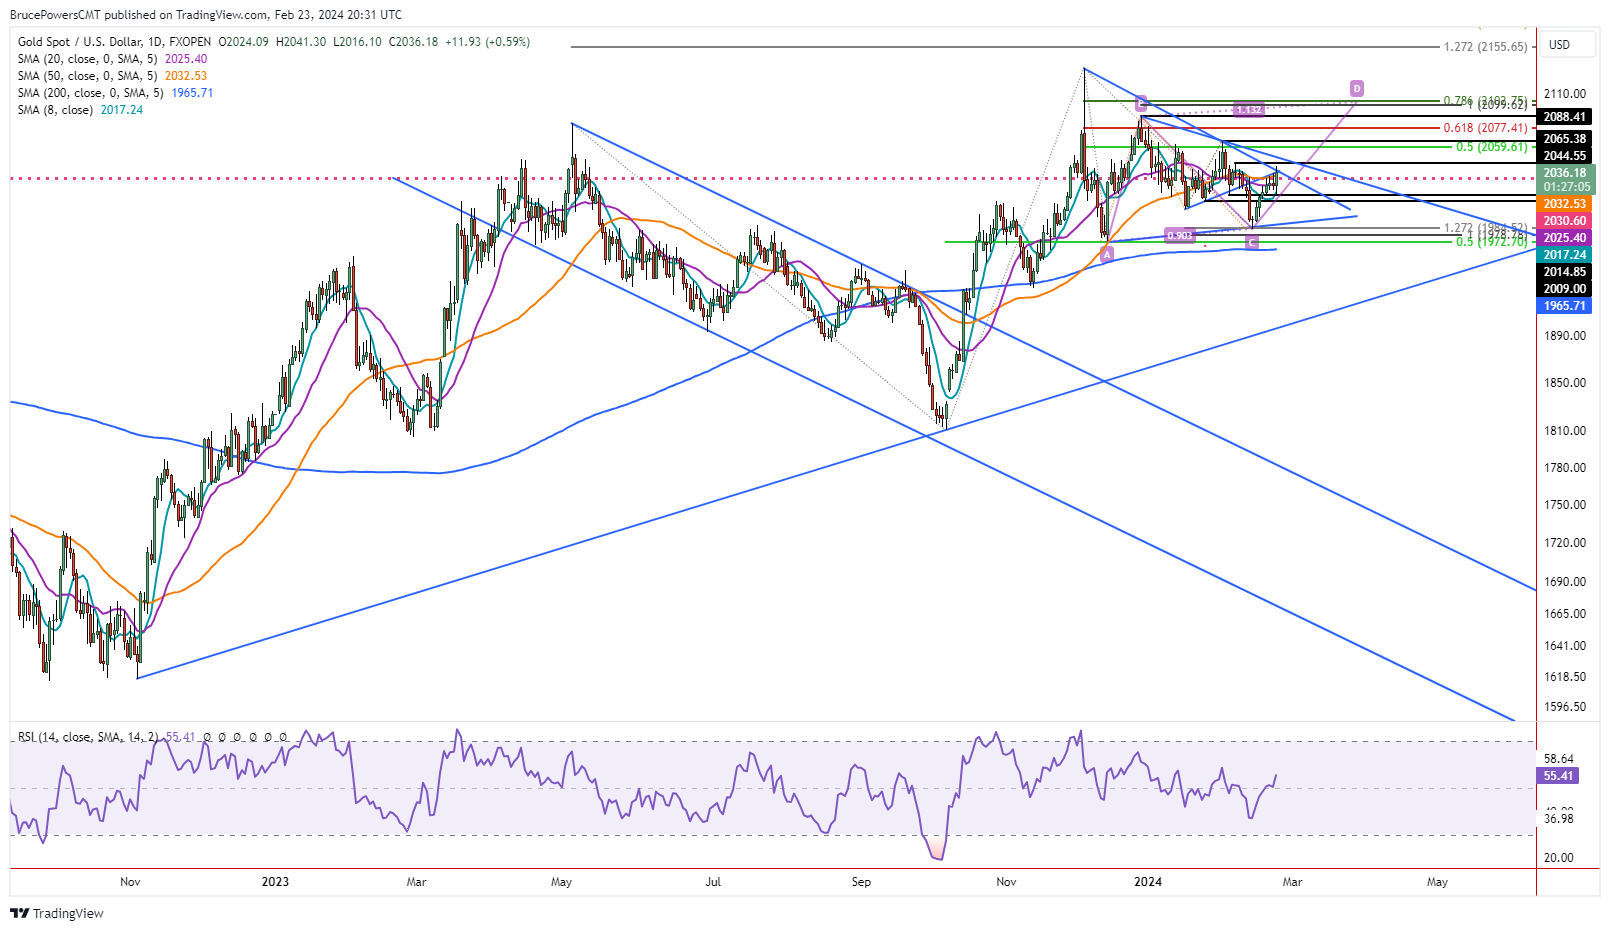
Gold is set to end the week in a strong position and at a new short-term trend high. This follows a drop earlier in the session and test of support at the 8-Day MA. Price was subsequently rejected to the upside as buyers took back control and drove the price of gold up through the consolidation range from the past couple of days to a new 11-day high. Resistance stopped the ascent at 2,041, at the time of this writing.
Early Session Weakness Reverses to 2-Week High
A reversal of an initial selloff to a three-day low in one day is generally bullish and it can be expected to lead to a continuation of the advance. Today’s rally, and likely weekly close above 2,031, will confirm this week’s breakout of last week’s bullish hammer candlestick pattern. Moreover, gold is on track to close strong for the week, in the upper quarter of the week’s trading range. This will leave it with a wide range green candlestick pattern for the week, which signals improving demand.
Weekly Bullish Breakout Confirms
The bullish breakout just began so further upside is more clearly on the horizon now, than it was only yesterday. Friday’s high and therefore the weekly high, at the time of this writing, was 2,041. That is right at the downtrend line. That line marks dynamic resistance of the downtrend that begins from the December 4 record high of 2,135. A second internal trend line has been added to the chart to provide additional context. A breakout of a trendline is not necessarily giving a signal as much as providing additional evidence that shows demand improving.
Large Symmetrical Triangle Pattern Breakout Should be Next
In addition to a successful breakout above the 50-Day MA today, gold is also back above a key price level from the August 2020 swing high at 2,031 (dotted red horizontal). That line has been roughly near the center of a consolidation range for the past several months. It takes the form of a symmetrical triangle, and if you add the preceding rally to the pattern, starting from the October low, you get a large bullish pennant. Therefore, a decisive breakout above this week’s high will be the first indication of a breakout of the triangle. A more reliable indication of strength will be provided on a rally above the 2,065-swing high. Nevertheless, the next level that needs to be broken is the minor swing high at 2,045.
About the Author
Bruce Powersauthor
Bruce boasts over 20 years in financial markets, holding senior roles such as Head of Trading Strategy at Relentless 13 Capital and Corporate Advisor at Chronos Futures. A CMT® charter holder and MBA in Finance, he's a renowned analyst and media figure, appearing on 150+ TV business shows.
Did you find this article useful?
Latest news and analysis


Advertisement