
Advertisement
Advertisement
Gold Price Forecast: Bullish Reversal Sparks Rally
By:
Thursday's rally marks the start of a bullish reversal, with higher target areas expected if gold can stay above 1,990.

In this article:
Gold Forecast Video for 16.02.24 by Bruce Powers
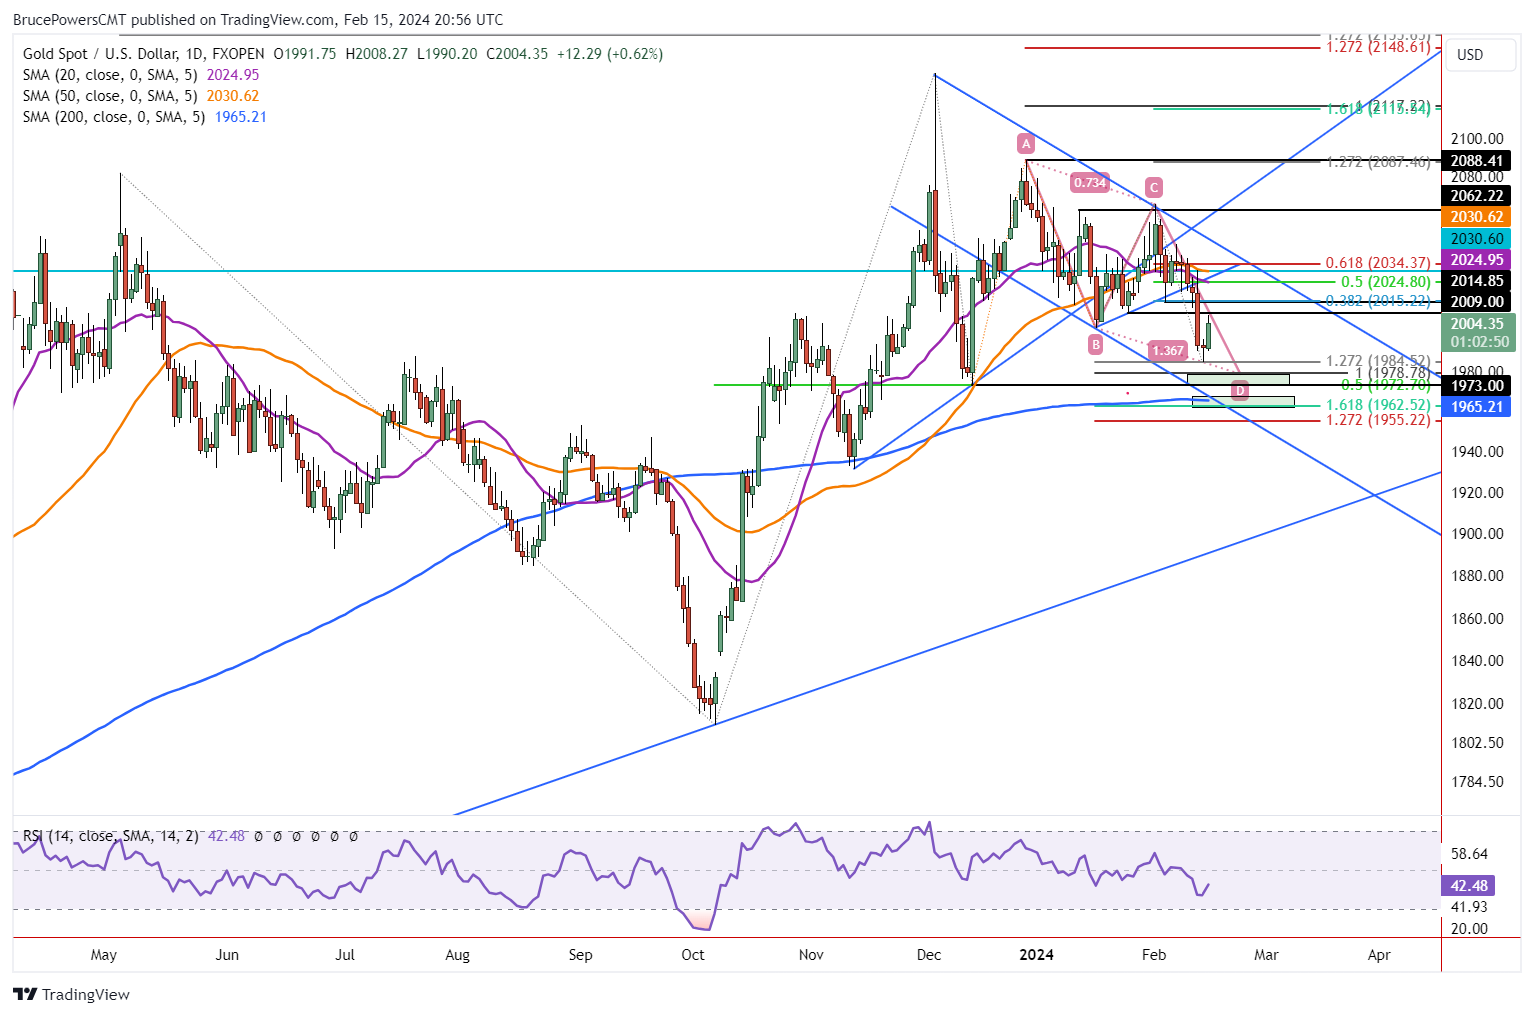
A bullish reversal off Wednesday’s bottom hammer candlestick pattern triggered on Thursday, leading to a sharp advance to test resistance around the 2,009 interim swing low. Gold hit a high of 2,008 today before finding intraday resistance and pulling back. Since this is just the first day of the reversal a continuation to higher prices seems likely. Whether that happens tomorrow or following an interim rest day, an inside day possibly, remains to be seen. Nonetheless, a drop below today’s low of 1,990 makes a bullish resolution to today’s breakout much less likely.
Volatility Increases
Since Tuesday’s sharp selloff triggered a spike in volatility, it looks like today’s bullish price action may be in reaction to that downward spike. The volatility spike is reflected in the relatively large ranged red candlestick that occurred on that day. Following Wednesday’s dip to a new trend low of 1,984, Thursday’s bullish breakout shows buyers again taking control. A daily close within the top third, and especially the top quarter, of the day’s price range will indicate strength that could easily spill into the coming days.
Only First Day of Reversal
Today’s rally is only the first day of a daily bullish reversal. Therefore, higher target areas have a good chance of getting hit eventually as long as gold stays above 1,990. Tuesday’s high of 2,031 is seen as a key upside pivot and it also near resistance represented by the 50-Day MA. A minor swing high occurred at 2,015 and there could resistance seen there. It is confirmed by the 38.2% Fibonacci retracement, which completes at the same price. Further up is the combination of the 50% retracement and 20-Day MA around 2,024.
Playing with 2020 Record High in Gold
Interestingly, the light blue horizontal line on the chart at 2,031 comes from the August 2020 trend high. That was a significant pivot level as it was followed by a 21% correction and retained the record high price for gold for 18 months. Therefore, a breakout above and subsequent daily close above the 50-Day line, now at 2,031, provides a bullish signal that should lead to a breakout above the upper downtrend line and therefore a completion of the current correction.
For a look at all of today’s economic events, check out our economic calendar.
About the Author
Bruce Powersauthor
Bruce boasts over 20 years in financial markets, holding senior roles such as Head of Trading Strategy at Relentless 13 Capital and Corporate Advisor at Chronos Futures. A CMT® charter holder and MBA in Finance, he's a renowned analyst and media figure, appearing on 150+ TV business shows.
Did you find this article useful?
Latest news and analysis


Advertisement