
Advertisement
Advertisement
Gold Price Forecast: Key Indicators and Targets
By:
Gold's surge to a four-week high signals robust bullish momentum, supported by successful tests of key support and the potential for continued strength in the market.

In this article:
Gold Forecast Video for 02.02.24 by Bruce Powers
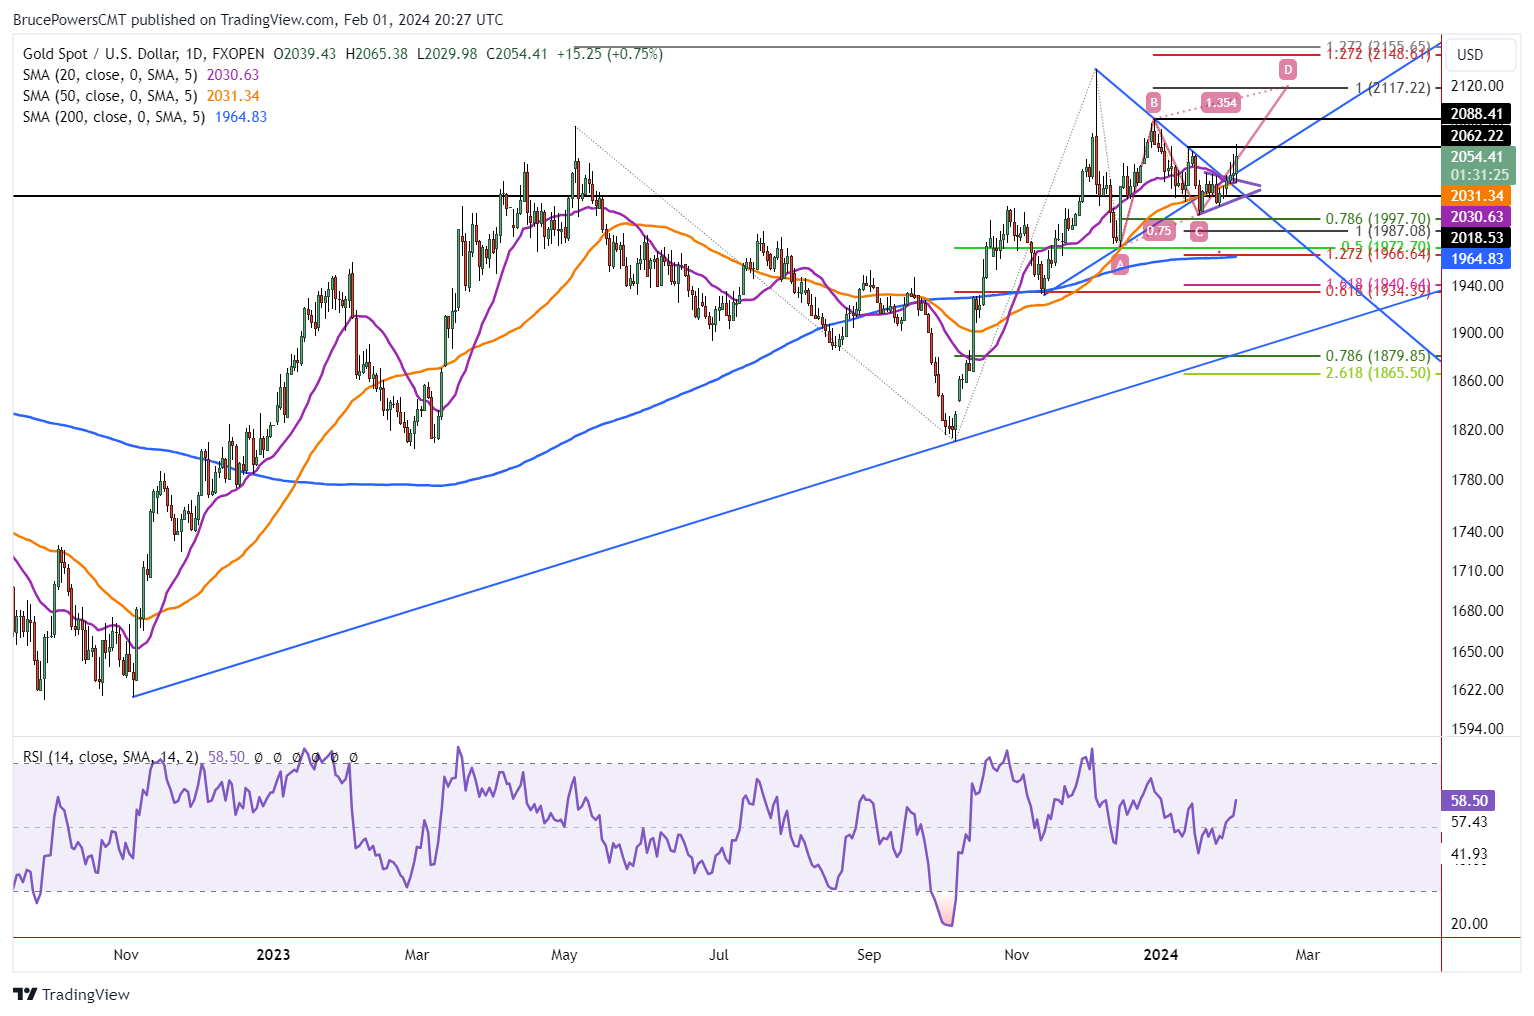
Bullish momentum in gold improved today as the precious metal hit a four-week high and a higher daily high. And it may be able to end Thursday’s session above Wednesday’s high of 2,056. It also exceeded the 2,062-swing high but could not hold above it. As seen yesterday as well, today’s low successfully tested support at the top of the pennant consolidation pattern, the downtrend line, and both the 20-Day and 50-Day MAs.
Successful Test of 50-Day Moving Average Support is Bullish
Notice that the two moving averages have converged and therefore identify a similar price level. That is the market telling us that it recognizes the moving averages. Having them together at the breakout area, along with the downtrend line, increases the significance of the breakout and potentially improves the chance for a strong rally.
Nevertheless, markets don’t make trading and investing easy. Certainly, it is possible to see a relatively clear bullish continuation. As well, throwbacks and further tests of support will still occur. The degree of weakness and subsequent recovery will tell us something about the dynamics of support and demand. The 50-Day line has successfully been tested as support four times since the gold rallied back above the line with enthusiasm in mid-October. Therefore, it should be a good dynamic support area to watch going forward. Moreover, a drop back below the line should be noted as a sign of weakness.
Weekly Chart Confirms Strength
The weekly chart confirms strength as gold is set to end this week at its highest weekly closing price in four weeks. A close above 2,062 would put it at a four-week high, not just a closing high. The next upside target looks to be around the prior swing high at 2,088. Following that target is the completion of a rising ABCD pattern at 2,117. Once gold closes above 2,062 the chance for continued strength increases. Similarly, a daily close above the 2,088-swing high is a sign of strength, and it should increase the chances of a continuation higher. Gold looks to have its sights set on new record highs this year. This could be the beginning of the rally that takes us there.
For a look at all of today’s economic events, check out our economic calendar.
About the Author
Bruce Powersauthor
Bruce boasts over 20 years in financial markets, holding senior roles such as Head of Trading Strategy at Relentless 13 Capital and Corporate Advisor at Chronos Futures. A CMT® charter holder and MBA in Finance, he's a renowned analyst and media figure, appearing on 150+ TV business shows.
Did you find this article useful?
Latest news and analysis


Advertisement