
Advertisement
Advertisement
Gold’s Conflicting Signals: Bullish Breakout but Weak Follow Through
By:
Gold's recent bullish breakout raises eyebrows as weak closes cast doubt on its sustainability. Could further consolidation be needed before a strong uptrend unfolds?

In this article:
Gold Forecast Video for 01.02.24 by Bruce Powers
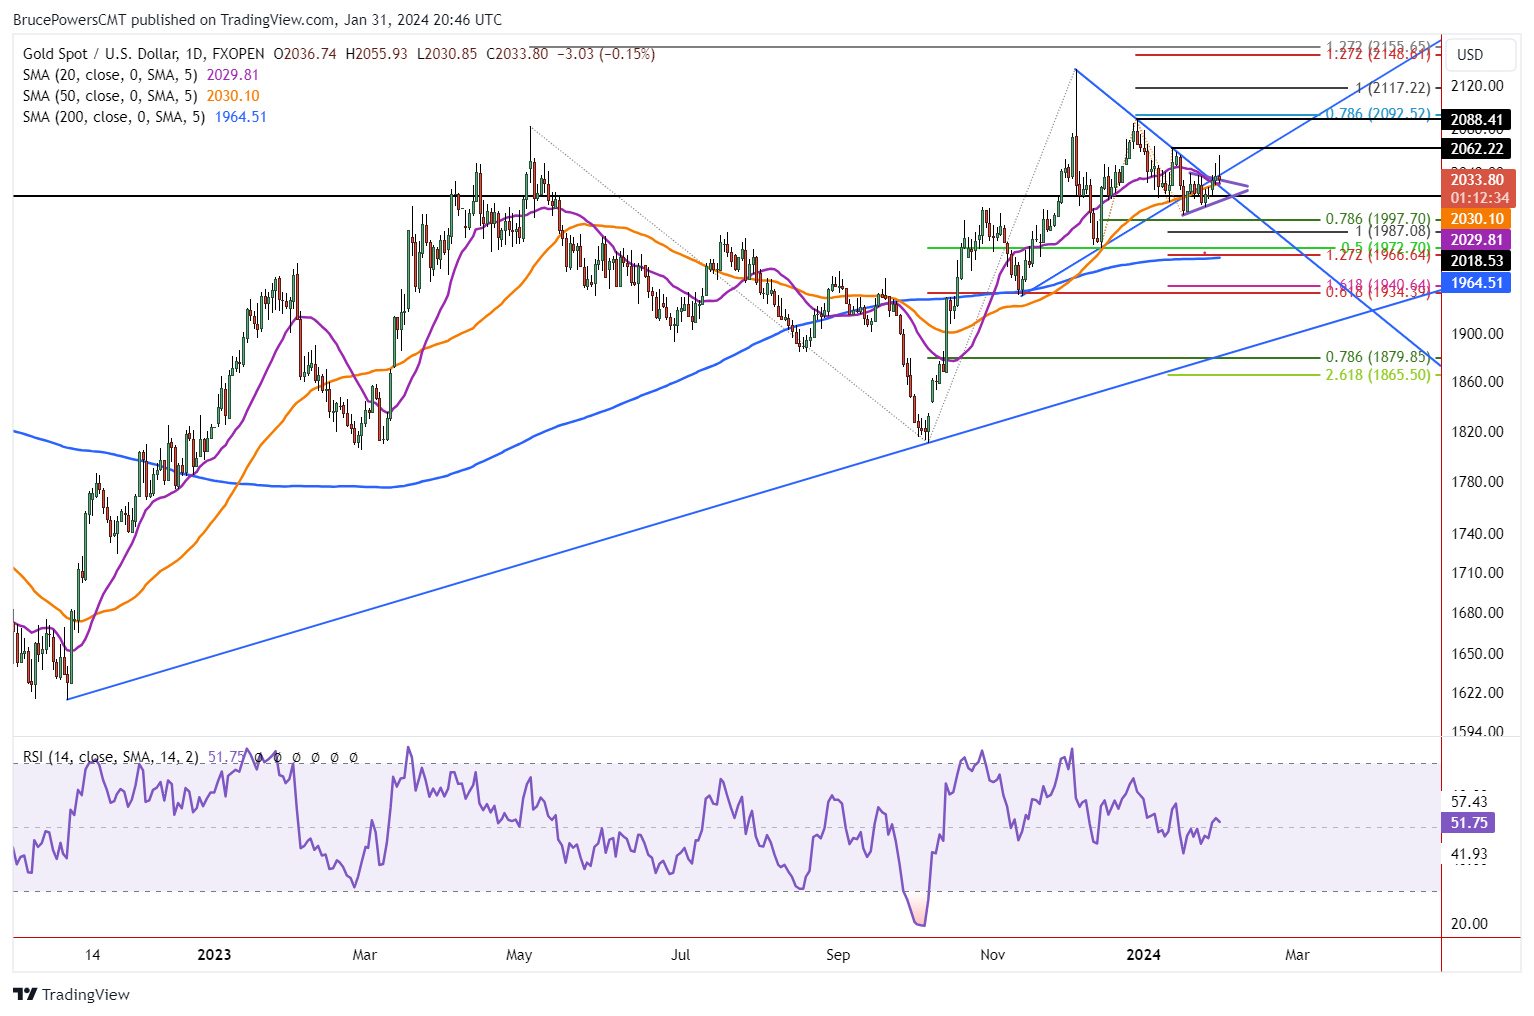
Although gold is triggering bullish signals, the advance is suspect. A bullish breakout of a pennant consolidation pattern (purple lines) and last week’s high occurred Tuesday. But the close was weak, in the lower third of the day’s range, although it was above the top boundary line of the pattern. Support was tested successfully at the 50-Day MA (orange) and 20-Day (purple) yesterday and then again today.
Wednesday’s advance created the fourth day in a row of higher daily highs and higher daily lows, which shows price improvement. However, it is on track to end Wednesday’s session weak at the time of this writing, in the bottom third of the day’s range once again.
Bullish Breakout Not Convincing
Weak price behavior following what could be a significant bullish reversal makes it suspect. Might gold need more time to test support and consolidate before it is ready to continue its uptrend? Certainly, it is possible as the breakout so far is not encouraging. An upside breakout should show demand improving. Preferably, there are clear signs of strength that make strength indicated by the breakout more likely to be sustained.
Weakness Likely on Drop Below 2,029
A drop below Tuesday’s low of 2,029 could lead to a test of support at the lower boundary of the pennant. In addition, potential support around the downtrend line needs to be watched. The most recent minor swing low at 2,009 is a key level as a drop below there will confirm a breakdown of the pennant. If that happens, it will indicate a failure of the bullish weekly breakout and upside pennant breakout. Lower prices will then be at risk of being tested. A key lower potential support level is the 200-Day MA at 1,964/1,1965.
Watch This Week’s Close for Clue
One of the next indications of strength will be to see whether gold can close above this week’s high of 2.038. That would confirm a weekly bullish breakout. Even with low upside momentum in this week’s breakout, the recovery should eventually be higher if that happens. January was an inside month for gold, and it creates a monthly bullish setup. An upside monthly breakout will trigger above 2,079.
For a look at all of today’s economic events, check out our economic calendar.
About the Author
Bruce Powersauthor
Bruce boasts over 20 years in financial markets, holding senior roles such as Head of Trading Strategy at Relentless 13 Capital and Corporate Advisor at Chronos Futures. A CMT® charter holder and MBA in Finance, he's a renowned analyst and media figure, appearing on 150+ TV business shows.
Did you find this article useful?
Latest news and analysis


Advertisement