
Advertisement
Advertisement
Decoding Gold’s Path: Price Levels, Retracements, and Monthly Trends
By:
Gold retraces further after encountering resistance at yesterday’s 2,048 high.

In this article:
Gold Forecast Video for 18.12.23 by Bruce Powers
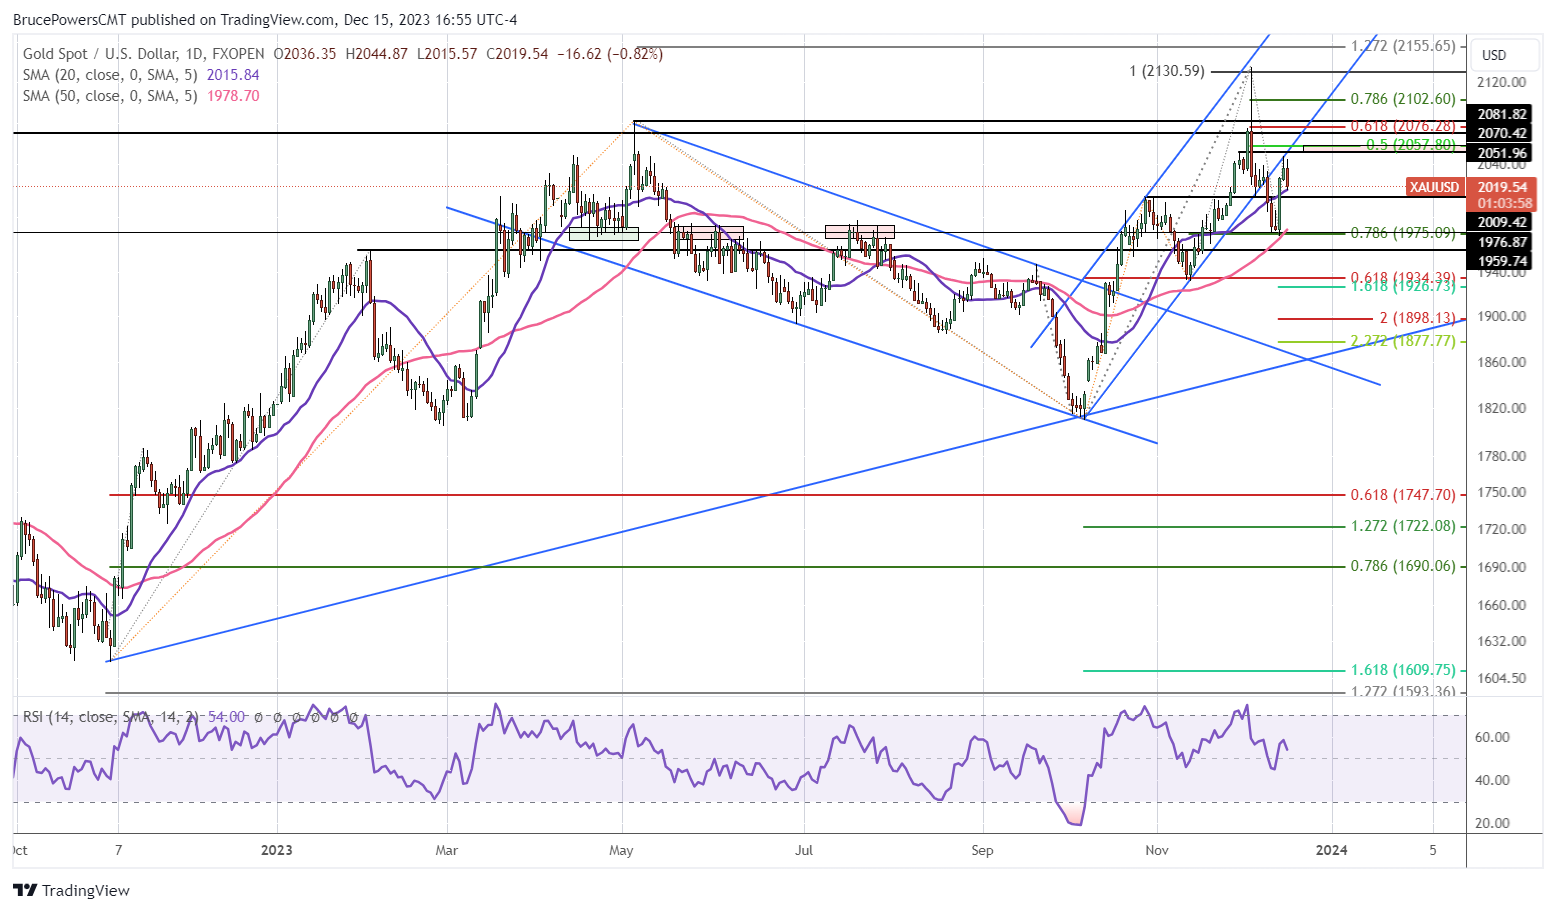
Gold encountered resistance at a high of 2,048 yesterday, leading to a minor retracement today, as it dips below yesterday’s low of 2,024. Also, it is on track to close below that price level as it tests support around the 20-Day MA (purple), which is currently at 2,016. Trading continues near the low of the day at the time of this writing, but 2,016 is the level so far. A little lower is potential support around the prior swing high at 2,009. That is also a 50% retracement of the three-day advance. Subsequently, that price area was recognized as support during the minor swing low on December 5.
Not Ending the Week as Strong as it Might
On a weekly basis (not shown), gold is set to end the week weaker than it might. The week is on track to end higher than it opened, generating a green candle. Although the close will be above the halfway point of the week’s range at 2,010, it is set to end below the top third of the week’s range, which would show greater strength. Possibly, this is a sign that today’s pullback may last longer than a day.
Resistance and Support Levels
Essentially, gold is contained between support in a range from 1,979 (20-Day MA) to 1,973 (retracement low) and resistance at yesterday’s high of 2,048. Also, there is a possible resistance zone a little higher at 2,052 to 2,057, consisting of a prior swing high and the 50% retracement, respectively. There have been two successful tests of support recently around the 20-Day MA and each was successful as price was rejected to the upside. This makes it a valid trend indicator for dynamic support going further. Further, the rising internal trendline was recognized by the market during the minor bounce following the December 5 swing low and at yesterday’s high.
Monthly Bullish Pattern Remains
On a monthly basis, gold triggered a bullish continuation this month as it advanced over November’s high of 2,052. That followed a monthly bullish continuation during November as well. So, there were two months up following the month of October, which is a confirmed bullish trend on the monthly time frame. The October low successfully tested support around the 50-Month MA for a second time thereby confirming the bullish trend on monthly basis.
For a look at all of today’s economic events, check out our economic calendar.
About the Author
Bruce Powersauthor
Bruce boasts over 20 years in financial markets, holding senior roles such as Head of Trading Strategy at Relentless 13 Capital and Corporate Advisor at Chronos Futures. A CMT® charter holder and MBA in Finance, he's a renowned analyst and media figure, appearing on 150+ TV business shows.
Did you find this article useful?
Latest news and analysis


Advertisement