
Advertisement
Advertisement
Gold’s Critical Juncture: Bullish Breakout or Bearish Retreat Ahead?
By:
As gold holds above 2,010, the market teeters on the edge. A breakout above 2,036 could signal renewed strength, while a decline may indicate a deeper correction ahead.

In this article:
Gold Forecast Video for 07.12.23 by Bruce Powers
Gold trades inside day on Wednesday, as it holds above Tuesday’s low and the retracement low at 2,010. That low completed a 61.8% Fibonacci retracement, and it matches a prior key swing high. Two indicators identifying the same price area and the subsequent rejection of price indicate that a retracement low may be in. If so, then a rise above today’s high of 2,036 will trigger a bullish inside day breakout. Whether gold continues higher from there or bounces and then turns back down, remains to be seen. First, an upside breakout is needed as a sign of strength.
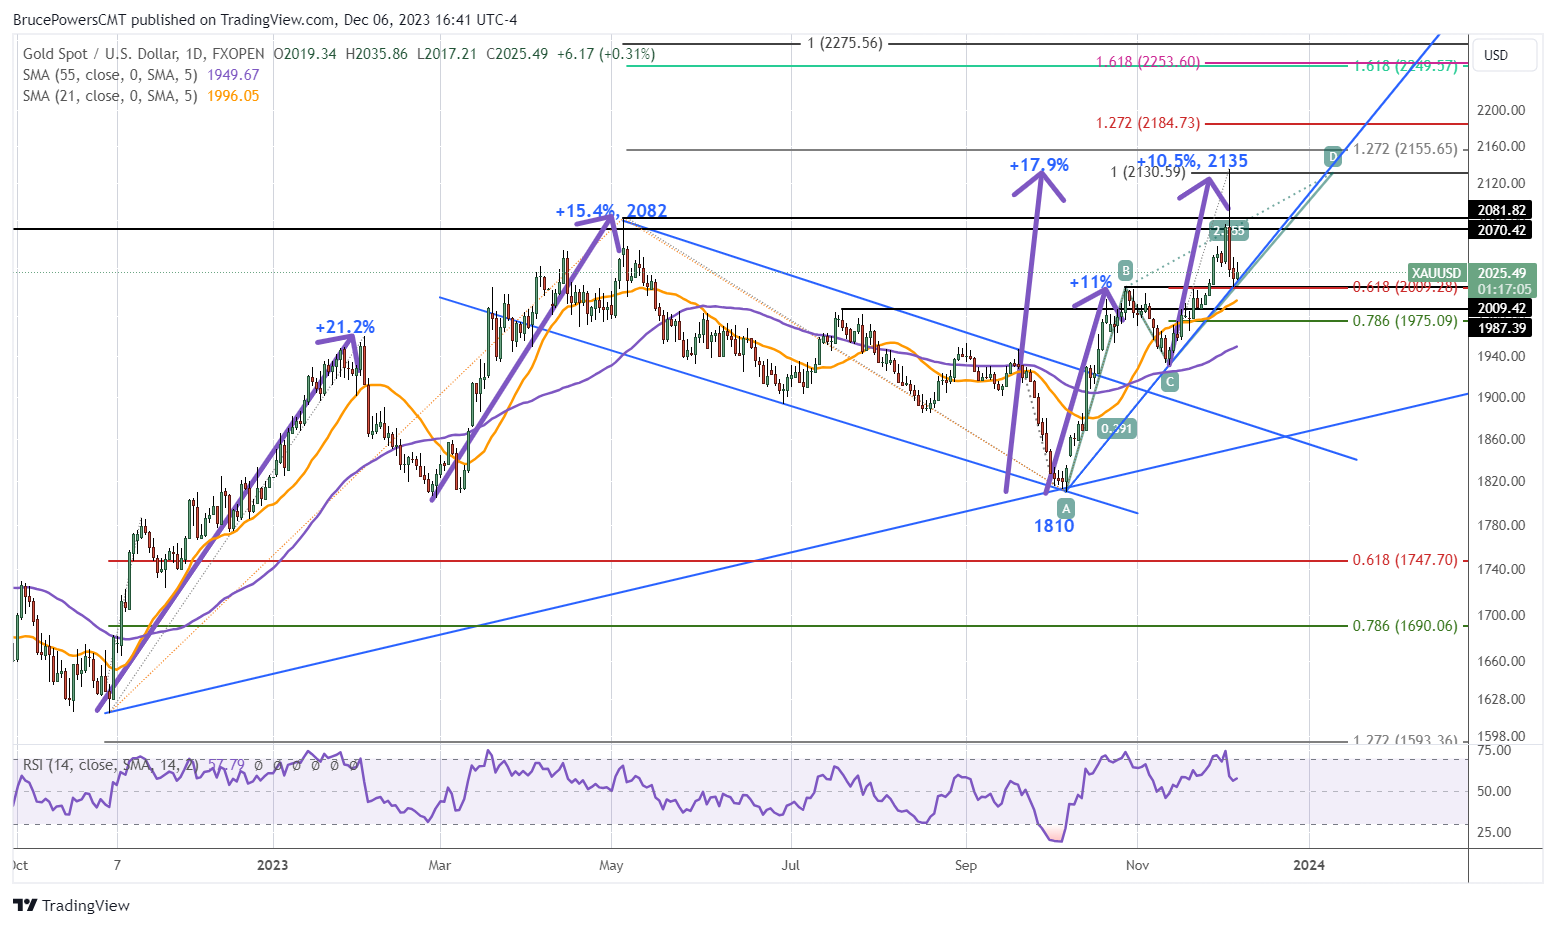
Inside Day Breakout Will First Target 2,0152
Upon a bullish signal gold heads up into the wide price range from Monday. It provides a wide area that gold may trade within before triggering a trend continuation signal above 2,135. Price levels to be aware of on the way up include a previous minor swing high at 2,052. There is then a weekly high at 2,075, which matches the prior record high of 2,070 from March 2022. A little higher is the prior record swing high of 2,082.
Downside Trigger Points to Retest of Lows
On the downside, a breakout below today’s low of 2,017 signals a likely retest of the 2,010-price area and increases the chance for a drop below that price level. Gold came down hard off the 2,135 high on Monday and generated a very wide range day reflecting a spike in volatility. It wouldn’t be surprising to see it take more time for a correction, either testing lower prices as support or consolidating. Note that the low on each of the past two days sits right on support of the internal uptrend line. Therefore, a decisive decline below today’s low will also put gold below the uptrend line, a sign of weakening.
Nevertheless, a drop below this week’s low is needed to signal a continuation of the retracement. If this scenario occurs, then watch for potential support around the 21-Day MA at 1,996 followed by a prior swing high at 1,987. A little lower will complete the 78.6% Fibonacci retracement at 1,975.
For a look at all of today’s economic events, check out our economic calendar.
About the Author
Bruce Powersauthor
Bruce boasts over 20 years in financial markets, holding senior roles such as Head of Trading Strategy at Relentless 13 Capital and Corporate Advisor at Chronos Futures. A CMT® charter holder and MBA in Finance, he's a renowned analyst and media figure, appearing on 150+ TV business shows.
Did you find this article useful?
Latest news and analysis


Advertisement