
Advertisement
Advertisement
Gold’s Downtrend: Will It Reverse or Continue? Key Analysis Inside
By:
Gold experiences a bearish trend continuation as it dips below 1,915, but a potential bullish reversal looms as it bounces off key support near 1,907.53.

In this article:
Gold Forecast Video for 13.09.23 by Bruce Powers
The retracement in gold continued today as it triggered a bearish continuation of the downtrend on a drop below 1,915. Both trend indicators, the 200-Day EMA and lower uptrend line were tested as support during the drop. The 200-Day line was busted to the downside briefly, while gold bounced right off support around the lower uptrend line with a day’s low of 1,907.53. A 61.8% Fibonacci retracement was completed at 1,911. After the low was hit, gold bounced. It is on track to close back above the 200-Day line.
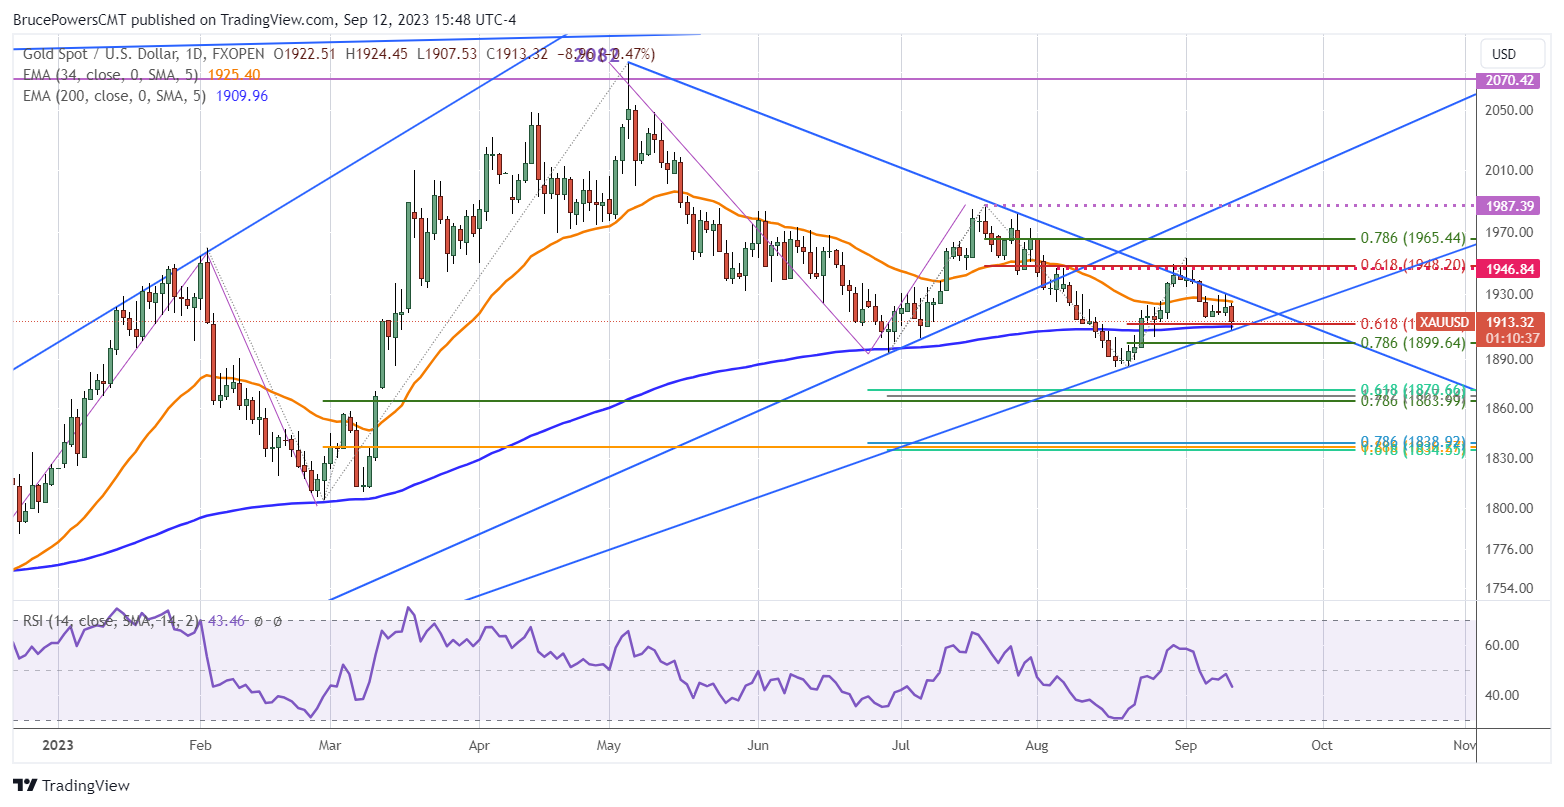
Today’s low is near term support and a drop below it triggers a bearish continuation. The 78.6% Fibonacci retracement around 1,900 would be the first lower price target following a continuation. That level is then followed by the recent swing low at 1,885.
Volatility Likely to Increase Soon
Nevertheless, given today’s bullish intraday reversal from trendline support, the potential for today’s low to be the low for the retracement exists. Gold is currently trading between two trendlines heading in opposite directions that will cross soon. In about seven days they will cross. This means that gold will be breaking one of the lines, most likely within five days or less. Once a line is busted there is the potential for a noticeable spike in volatility and the direction becomes clearer. Until broken
Bullish Reversal Needed for Higher Prices
Larger Uptrend Gold remains in a larger uptrend. Strength indicated in the underlying uptrend should kick in again once bullish price action increases. An advance above today’s high of 1,924 provides a bullish indication on the daily chart. However, the 1,931 high of the past five days points to a more useful price level. That is the high for this week so far. Once 1,931 is exceeded to the upside gold will have cleared its bottoming pattern. It will then be back above both the downtrend line as well as the 34-Day EMA.
Given that the crossover of the two trend lines happens soon, gold may consolidate for a day or two first, before moving through one of the lines. As noted, although the expectation is for an upside breakout, the possibility of a downside move still exists.
For a look at all of today’s economic events, check out our economic calendar.
About the Author
Bruce Powersauthor
Bruce boasts over 20 years in financial markets, holding senior roles such as Head of Trading Strategy at Relentless 13 Capital and Corporate Advisor at Chronos Futures. A CMT® charter holder and MBA in Finance, he's a renowned analyst and media figure, appearing on 150+ TV business shows.
Did you find this article useful?
Latest news and analysis


Advertisement