
Advertisement
Advertisement
Gold Confirms Bullish Reversal on Weekly Time Frame, Targets 1,971
By:
A weekly bullish reversal confirms the beginning of an uptrend, while Fibonacci retracement and extension levels guide gold's trajectory.

In this article:
Gold Forecast Video for 14.07.23 by Bruce Powers
Gold continues to work its way higher and is set to complete its fifth day positive in a row. Although there was a higher high today momentum has slowed as represented by the relatively narrow ranged day. A daily close above yesterday’s high will show minor relative strength compared to a daily close above yesterday’s high.
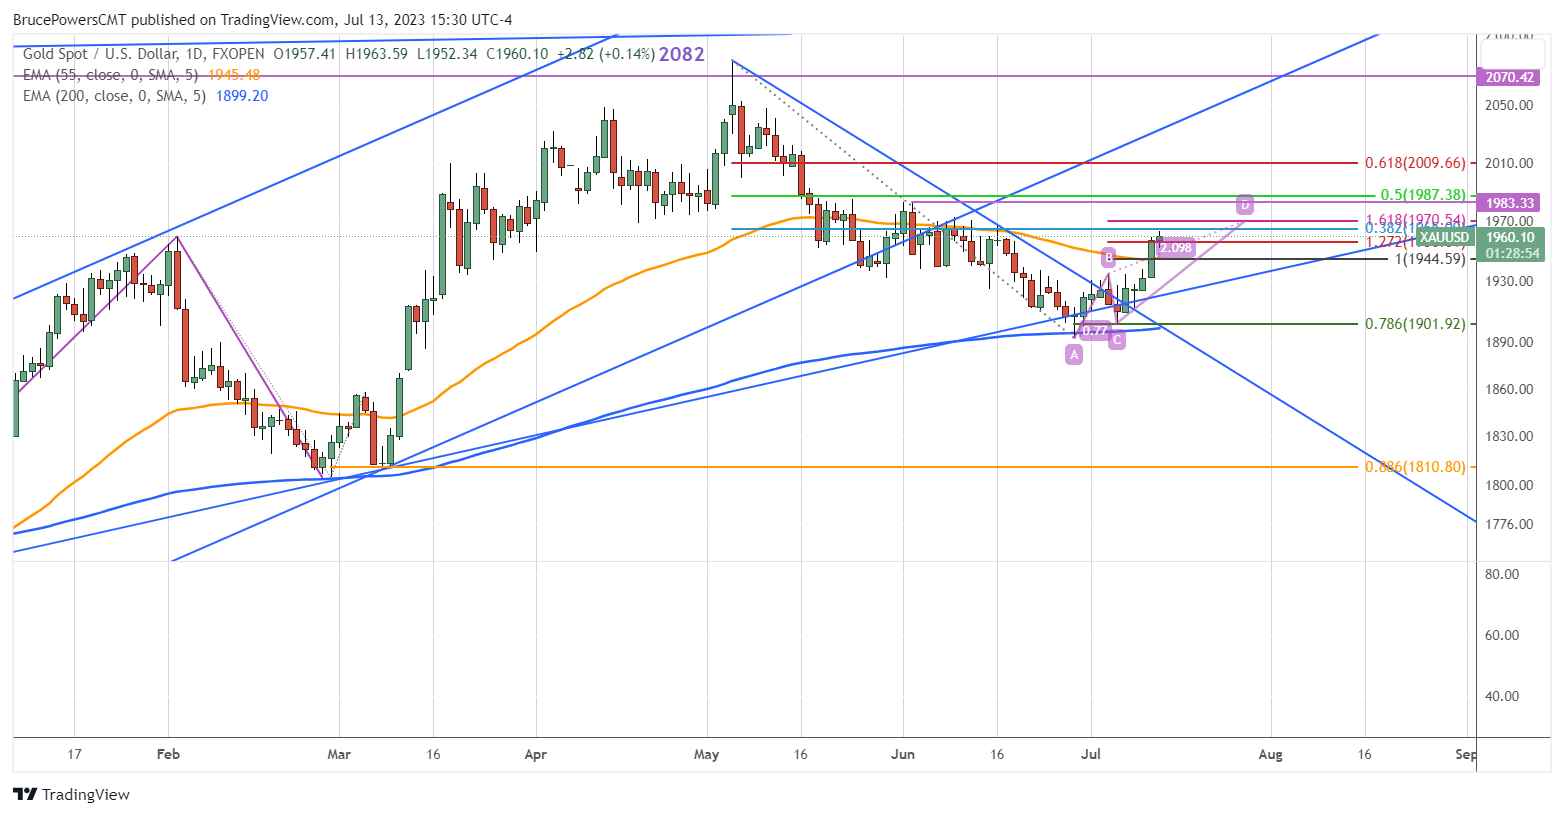
Momentum Not Yet Overbought According to RSI
The advance remains in place and the RSI momentum oscillator has not yet reached overbought. So, the expectation is for a continuation until proven otherwise. With a day’s high of 1,964, gold was just shy of a 38.2% Fibonacci retracement at 1,965. Following the completion of the 38.2% retracement, gold will next be heading towards the 161.8% extension of the CD leg of the ABCD pattern as shown in the chart around 1,971. The 127.2% extension was hit yesterday at 1,945.
Bullish Weekly Reversal Confirmed
Yesterday, Wednesday, a weekly bullish reversal was confirmed as yesterday closed above last week’s high of 1,934. Once a trend begins it tends to continue for some period. We just got a bullish signal on the weekly chart, which means gold is at the beginning of a bullish reversal and the start of an uptrend. This next portion of the uptrend will be a piece of the larger rising trend that began off the June bottom of 1,893. A daily close above the four-week high of 1,959 will provide the next weekly bullish confirmation signal. That could happen today as gold is trading right around the level at the time of this writing.
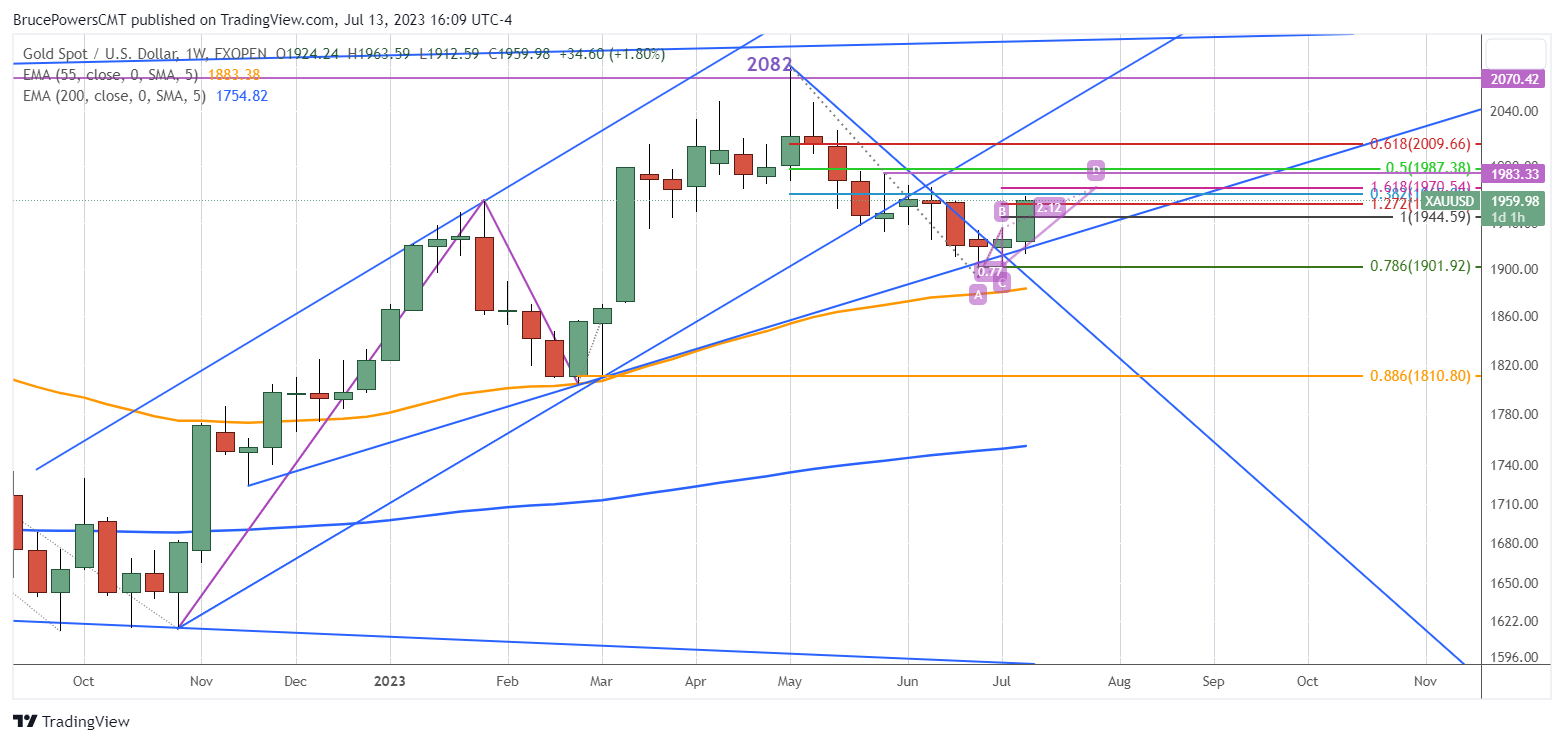
Prior Two Rallies Saw Similar Beginnings
Following the bottoming of the two prior corrections, gold had a one-week sharp rally ending in a wide-ranging green candle starting from the bottom of the range to the top. Once that rally week was over gold paused and traded with low volatility for a couple weeks before it continued to ascend. Subsequently, gold continued to rise but at an obviously slower pace. Seems like there is a good chance we could see similar behavior again. It has happened twice already. Also, if it does not happen, that will be insightful about the future of gold as well.
For a look at all of today’s economic events, check out our economic calendar.
About the Author
Bruce Powersauthor
Bruce boasts over 20 years in financial markets, holding senior roles such as Head of Trading Strategy at Relentless 13 Capital and Corporate Advisor at Chronos Futures. A CMT® charter holder and MBA in Finance, he's a renowned analyst and media figure, appearing on 150+ TV business shows.
Did you find this article useful?
Latest news and analysis


Advertisement