- Natural Gas Price seesaws around one-week high as the key technical levels challenge further upside.
- 200-SMA prods XNG/USD buyers amid nearly overbought RSI conditions.
- Multiple supports, bullish MACD signals can put a floor under the Natural Gas Price even as rising wedge teases bears.
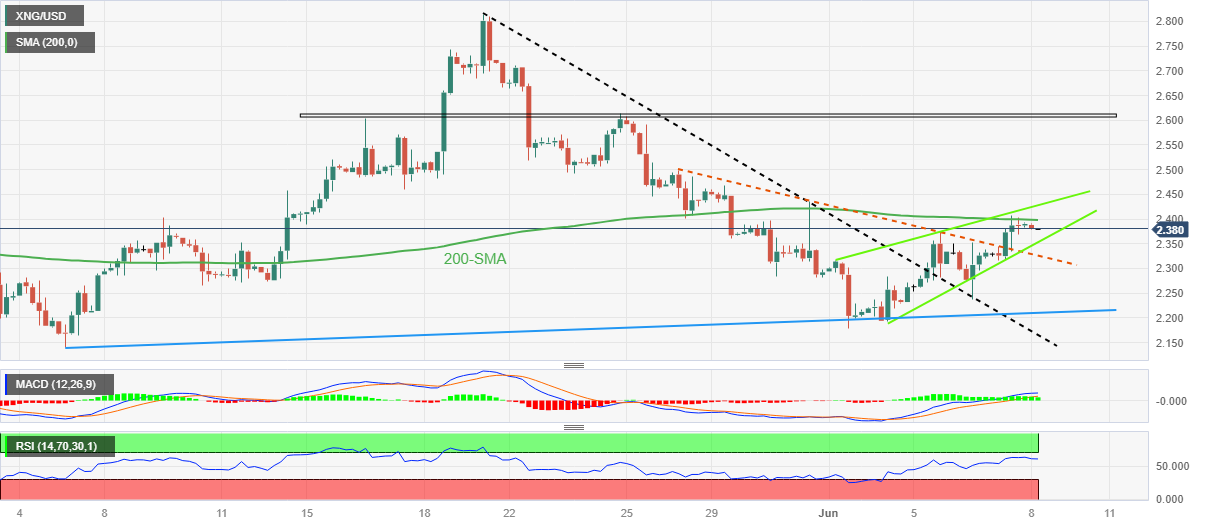
Natural Gas (XNG/USD) Price eases from the weekly top, paring intraday gains, as the energy instrument buyers fail to cross the 200-SMA amid early Thursday. With this, the XNG/USD prints mild losses of around $2.38 by the press time.
In doing so, the asset also eases within a one-week-old rising wedge bearish chart formation, currently between $2.35 and $2.43.
Apart from the 200-SMA and rising wedge, the nearly overbought RSI (14) line also teases the Natural Gas sellers.
However, the quote needs to break the $2.35 support to confirm the bearish chart pattern suggesting a theoretical fall toward $2.15.
During the anticipated downside, the previous resistance line from May 26, close to $2.32 at the latest, can act as an extra filter towards the north.
Following that, a two-month-old ascending trend line and resistance-turned-support from May 19, respectively near $2.20 and $2.16, can challenge the Natural Gas sellers before directing them to the $2.15.
On the contrary, an upside break of the 200-SMA hurdle of $2.40 needs validation from the stated wedge’s top line surrounding $2.43 to convince the XNG/USD bulls.
Even so, the late May swing high around $2.50 and a three-week-long horizontal resistance area around $2.60-61 can challenge the Natural Gas upside before welcoming the bulls.
Natural Gas Price: Four-hour chart
Trend: Limited downside expected
Information on these pages contains forward-looking statements that involve risks and uncertainties. Markets and instruments profiled on this page are for informational purposes only and should not in any way come across as a recommendation to buy or sell in these assets. You should do your own thorough research before making any investment decisions. FXStreet does not in any way guarantee that this information is free from mistakes, errors, or material misstatements. It also does not guarantee that this information is of a timely nature. Investing in Open Markets involves a great deal of risk, including the loss of all or a portion of your investment, as well as emotional distress. All risks, losses and costs associated with investing, including total loss of principal, are your responsibility. The views and opinions expressed in this article are those of the authors and do not necessarily reflect the official policy or position of FXStreet nor its advertisers. The author will not be held responsible for information that is found at the end of links posted on this page.
If not otherwise explicitly mentioned in the body of the article, at the time of writing, the author has no position in any stock mentioned in this article and no business relationship with any company mentioned. The author has not received compensation for writing this article, other than from FXStreet.
FXStreet and the author do not provide personalized recommendations. The author makes no representations as to the accuracy, completeness, or suitability of this information. FXStreet and the author will not be liable for any errors, omissions or any losses, injuries or damages arising from this information and its display or use. Errors and omissions excepted.
The author and FXStreet are not registered investment advisors and nothing in this article is intended to be investment advice.
Recommended content
Editors’ Picks
EUR/USD flirts with daily tops near 1.0730

The continuation of the selling pressure in the Greenback now lends further oxygen to the risk complex, encouraging EUR/USD to revisit the area of daily highs near 1.0730.
USD/JPY looks stable around 156.50 as suspicious intervention lingers

USD/JPY remains well on the defensive in the mid-156.00s albeit off daily lows, as market participants continue to digest the still-unconfirmed FX intervention by the Japanese MoF earlier in the Asian session.
Gold advances for a third consecutive day

Gold fluctuates in a relatively tight channel above $2,330 on Monday. The benchmark 10-year US Treasury bond yield corrects lower and helps XAU/USD limit its losses ahead of this week's key Fed policy meeting.
Week Ahead: Bitcoin could surprise investors this week Premium

Two main macroeconomic events this week could attempt to sway the crypto markets. Bitcoin (BTC), which showed strength last week, has slipped into a short-term consolidation.
Five Fundamentals for the week: Fed fears, Nonfarm Payrolls, Middle East promise an explosive week Premium
Higher inflation is set to push Fed Chair Powell and his colleagues to a hawkish decision. Nonfarm Payrolls are set to rock markets, but the ISM Services PMI released immediately afterward could steal the show.