- Gold’s rise was capped by US bond yields despite concerns for a gloomy economic outlook in the US sparked by weakness in business activity.
- The US Federal Reserve is expected to maintain interest rates unchanged at the June reunion, but recent central bank decisions worldwide suggest tightening monetary conditions loom.
- Technical analysis of XAU/USD suggests a potential inverse head-and-shoulders pattern, with a crucial resistance confluence of the 50 and 20-day EMAs to validate it.
Gold price retreats after hitting a daily high of $1966.34 as US bond yields edge higher, a headwind for the yellow metal. Investors sentiment is negative after reports of business activity in the United States (US) raised worries about a recession, underpinned the US Dollar (USD) by last week’s Federal Reserve (Fed) dovish comments, cushioned XAU/USD fall. At the time of writing, XAU/USD is trading at $1959.40, with losses of 0.10%.
Investor sentiment cools Gold’s rally as increasing US bond yields and signs of persistent inflation pressure the precious metal.
Sentiment improvement keeps the Gold price pressured. After dropping sharply on Monday, US Treasury bond yields recover, with the 10-year note rate at 3.708%, two basis points higher than the open, while US 10-year TIPS, a proxy for real yields, are at 1.521%, above the 1.50% mark, after Monday’s close below the latter.
Gold witnessed an increase in flows after the Institute for Supply Management’s (ISM) May figures for manufacturing and services painted a gloomy scenario in the United States (US). Even though the US jobs report was outstanding, with May Nonfarm Payrolls printing 339K jobs added to the economy, the Unemployment Rate advancing 0.3% to 3.7%, eased the Fed’s job of tackling stubbornly sticky inflation. That triggered a jump in US bond yields as investors disregarded a possible rate hike in June.
Traders expect a 76% chance that the US Federal Reserve would keep rates unchanged at the June 13-14 reunion, as shown by the CME Fed Watch Tool. Nevertheless, it should be noted that some central banks that paused rate hikes earlier re-engaged toward tightening monetary conditions as inflation proves to be persistent.
Amongst those, the latest surprise happened Tuesday early in the Asian session, with the Reserve Bank of Australia (RBA) lifting rates for the second straight meeting. Gold traders should remember that the RBAs skipped a meeting, just to witness a jump in inflation and wages. After that, 50 bps of tightening had been added to its cash rate, now at 4.10%.
On Wednesday’s Bank of Canada (BoC) decision, which also paused its tightening cycle but sounded more hawkish than expected on the latest meeting. TDS analysts noted, “We look for the BoC to hike by 25bp in June and 25bp in July. Ongoing economic resilience will lengthen the path back to 2.0% inflation, and as such, we believe the BoC needs to tighten further.” Furthermore, “Recent data have cleared the bar to additional hikes.”
Given the backdrop, we will see what the Federal Reserve decides the next week, but current central bank decisions could delineate what the Fed could do.
XAU/USD Price Analysis: Technical outlook
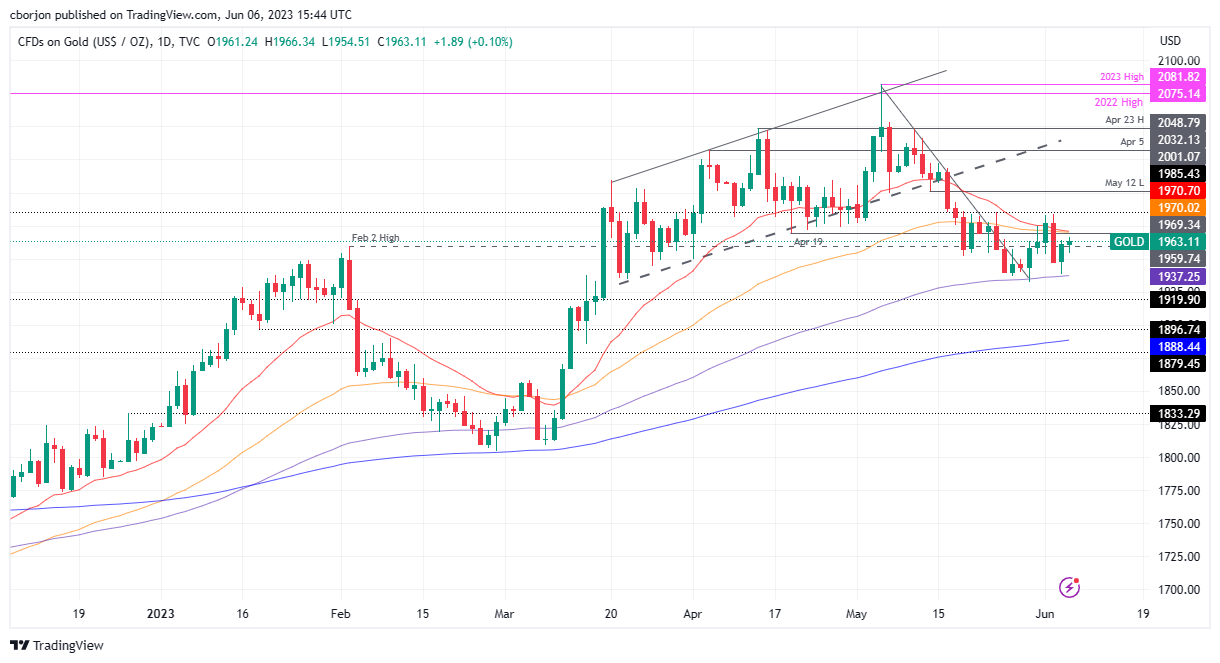
XAU/USD daily chart suggests the yellow metal is trading sideways, but an inverse head-and-shoulders could be forming. However, to validate the chart pattern, XAU/USD must rally past the confluence of the 50 and 20-day Exponential Moving Averages (EMAs) at $1969.90 and $1970.41, respectively. Once cleared, that would pave the way for the last week’s high of $1983.44, before aiming toward the May 12 low-shifted resistance at $1985.43, on XAU’s path toward the $2000 mark. Conversely, the pattern would be negated if XAU/USD tumbles below the 100-day EMA at $1937.19, followed by the May 30 daily low of $1932.20.
Information on these pages contains forward-looking statements that involve risks and uncertainties. Markets and instruments profiled on this page are for informational purposes only and should not in any way come across as a recommendation to buy or sell in these assets. You should do your own thorough research before making any investment decisions. FXStreet does not in any way guarantee that this information is free from mistakes, errors, or material misstatements. It also does not guarantee that this information is of a timely nature. Investing in Open Markets involves a great deal of risk, including the loss of all or a portion of your investment, as well as emotional distress. All risks, losses and costs associated with investing, including total loss of principal, are your responsibility. The views and opinions expressed in this article are those of the authors and do not necessarily reflect the official policy or position of FXStreet nor its advertisers. The author will not be held responsible for information that is found at the end of links posted on this page.
If not otherwise explicitly mentioned in the body of the article, at the time of writing, the author has no position in any stock mentioned in this article and no business relationship with any company mentioned. The author has not received compensation for writing this article, other than from FXStreet.
FXStreet and the author do not provide personalized recommendations. The author makes no representations as to the accuracy, completeness, or suitability of this information. FXStreet and the author will not be liable for any errors, omissions or any losses, injuries or damages arising from this information and its display or use. Errors and omissions excepted.
The author and FXStreet are not registered investment advisors and nothing in this article is intended to be investment advice.
Recommended content
Editors’ Picks
EUR/USD edges lower toward 1.0700 post-US PCE

EUR/USD stays under modest bearish pressure but manages to hold above 1.0700 in the American session on Friday. The US Dollar (USD) gathers strength against its rivals after the stronger-than-forecast PCE inflation data, not allowing the pair to gain traction.
GBP/USD retreats to 1.2500 on renewed USD strength

GBP/USD lost its traction and turned negative on the day near 1.2500. Following the stronger-than-expected PCE inflation readings from the US, the USD stays resilient and makes it difficult for the pair to gather recovery momentum.
Gold struggles to hold above $2,350 following US inflation

Gold turned south and declined toward $2,340, erasing a large portion of its daily gains, as the USD benefited from PCE inflation data. The benchmark 10-year US yield, however, stays in negative territory and helps XAU/USD limit its losses.
Bitcoin Weekly Forecast: BTC’s next breakout could propel it to $80,000 Premium

Bitcoin’s recent price consolidation could be nearing its end as technical indicators and on-chain metrics suggest a potential upward breakout. However, this move would not be straightforward and could punish impatient investors.
Week ahead – Hawkish risk as Fed and NFP on tap, Eurozone data eyed too

Fed meets on Wednesday as US inflation stays elevated. Will Friday’s jobs report bring relief or more angst for the markets? Eurozone flash GDP and CPI numbers in focus for the Euro.