
Advertisement
Advertisement
Analyzing Silver’s Price Action: Support, Resistance, and Trend
By:
The recent correction brings silver back into the price range of the trend channel, with potential support and resistance levels to watch for future price movements.

In this article:
Silver Forecast Video for 30.05.23 by Bruce Powers
Silver’s correction finds support at the 200-Day EMA and 50% retracement of the most recent trend, with a low of 2.66. That low was hit Friday, before silver turned higher to complete a reversal day (outside day), with a daily close above Thursday’s high. Monday’s trading is muted given the U.S., holiday but silver did manage to advance above Friday’s 23.32 high.
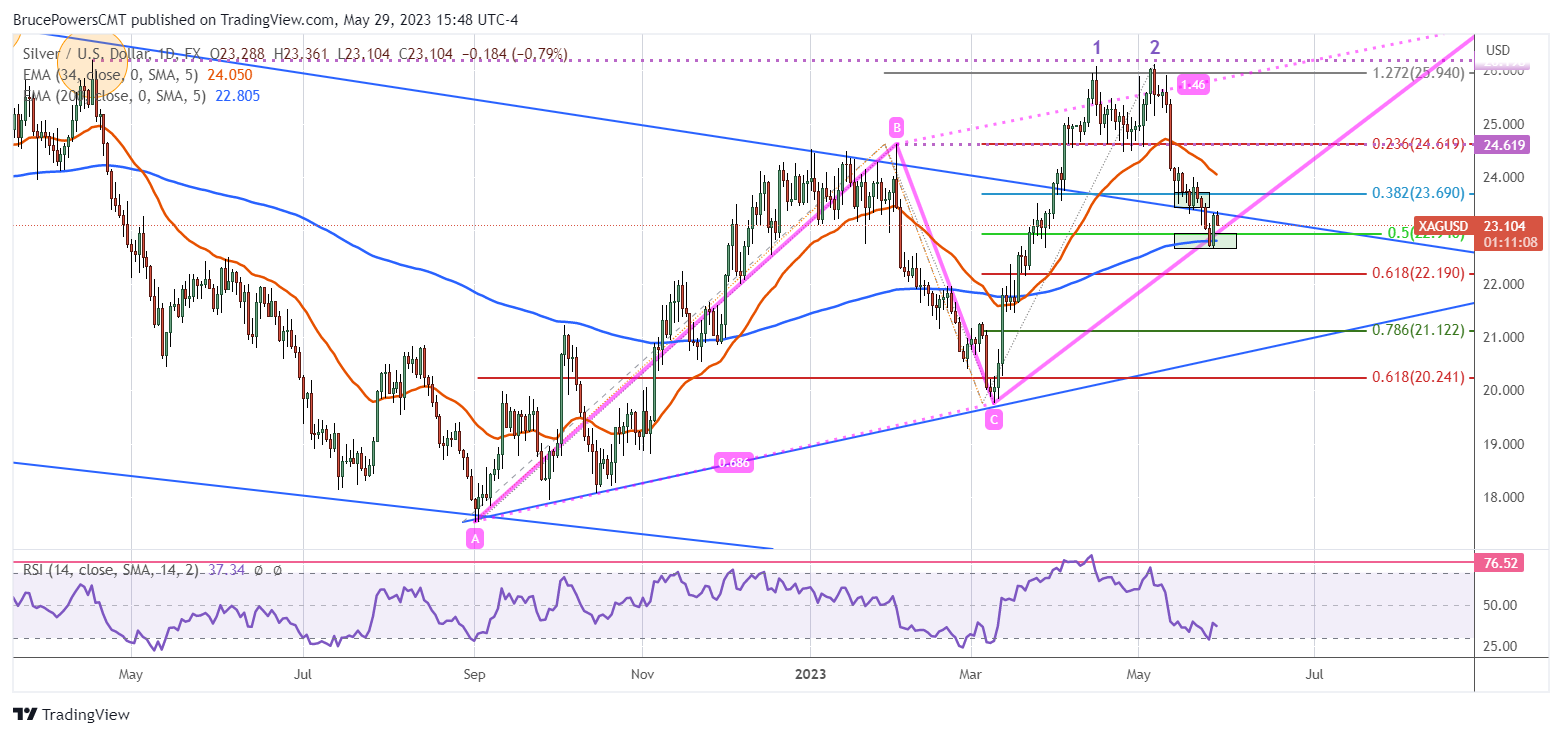
Downtrend Line Key Near Term Resistance
Resistance for today and Friday was seen around the downtrend line. Previously, the trendline identified support over eight consolidation days prior to it breaking below the line last Wednesday. A daily close above the line indicates that the correction may be close to complete, while a daily close below the line means downside risk for silver remains.
Bullish Outlook Strongest When Silver is Above its 200-Day EMA
The 200-Day EMA is a significant long-term trend indicator. Silver has traded both below and above the 200-Day line a variety of times over the past couple of years, since it has been forming a descending parallel trend channel. It broke out of the trend channel in early-April and confirmed strength by closing above the top trendline of the channel over multiple weeks, as well as monthly (April). This current correction has brought silver back into the price range of the channel. The RSI has just touched overbought, but prior similar readings during retracements were followed by price advancing.
If Last Week’s Low Fails to Hold, A Deeper Retracement is in the Works
If silver is to maintain the strength indicated by breaking out of a multi-year channel, a bullish reversal should eventually occur off the 200-Day EMA or higher. Otherwise, a deeper retracement may be in the works. Weakness is implied on a daily close below last week’s low of 22.66. If it occurs, silver would next be heading towards a support zone around the 61.8% Fibonacci retracement at 22.19. That support area is then followed by the 78.6% Fibonacci retracement at 21.12, along with the uptrend line.
Last week’s high to low range was relatively wide. So, it is possible that silver trades inside week all this week, and that it doesn’t gain sustainable upside momentum until it rises above last week’s high of 23.91. A daily close above that high confirms strength and a weekly breakout.
For a look at all of today’s economic events, check out our economic calendar.
About the Author
Bruce Powersauthor
Bruce boasts over 20 years in financial markets, holding senior roles such as Head of Trading Strategy at Relentless 13 Capital and Corporate Advisor at Chronos Futures. A CMT® charter holder and MBA in Finance, he's a renowned analyst and media figure, appearing on 150+ TV business shows.
Did you find this article useful?
Latest news and analysis


Advertisement