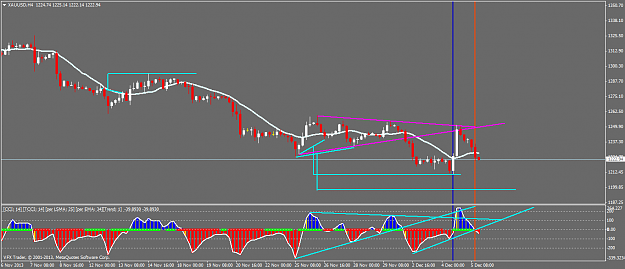
Disliked{quote} To use geometrical method requires you to be thinking of possibilities that require you to study the chart fro changes that are repetitive. If you recognise those patterns then you can "see" them. If not, then there is no known way I could teach you.Geometry shows where there is a repeat in a pattern that is too similar to be random event. Best way to learn it is to to study what images I have already posted. It does use mostly the !m charts on a 50" screen.Ignored
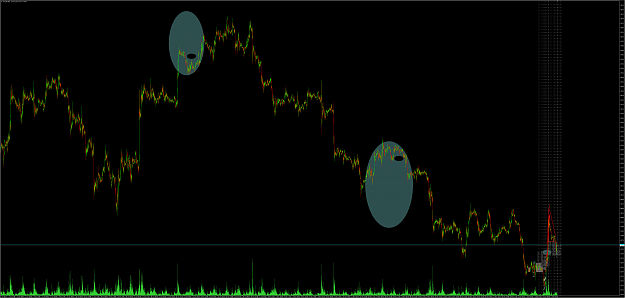
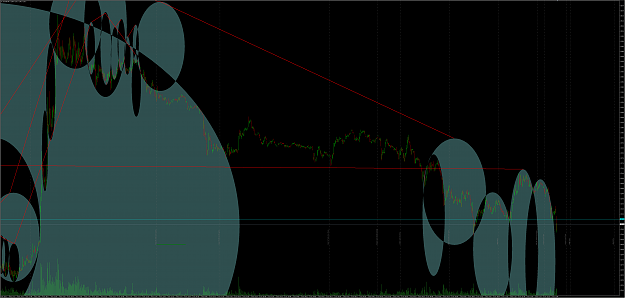
Disliked{quote} hi Goldenshot, i see theRhodie has already given you some thoughts. Like he says, the geomteric and circular techniques have no methodology - you just make it up as you go along in a way and some consistencies start showing up and eventually fade away. One thing I can say from experience is that these geometries - especially circles - manifest near major turning points in the market. for more about circles, check out FF member Kambooj - he has a thread called Circular Trendlines where he outlines his own methodology. But don't follow it...Ignored
The Force is with me.. Im One With the Force..