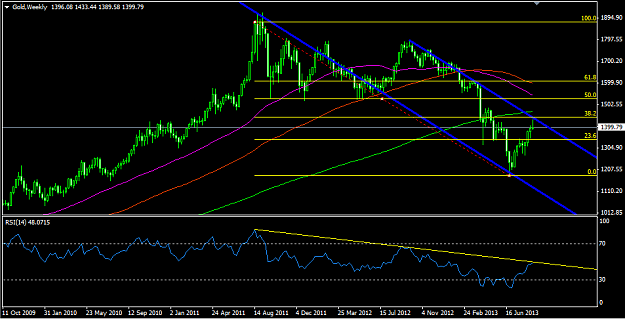
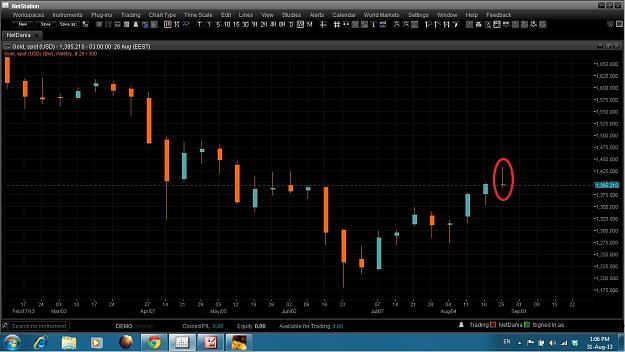
Firstly price had reached the 38.2 fib and the price have gone down.
Secondly we see the price have touched the upper blue parallel line and price have come done.
Thirdly we can see the weekly RSI is almost going to touch the RSI trend line, we can expect the RSI to go down from here.
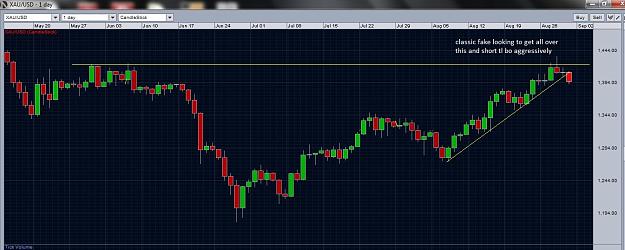
Fourthly the weekly candle stick is showing a sign of downward movement.
So over all gold price seems to be bearish.
I dont know if i am right or wrong, this is what i see in my chart. I would like senior member to correct me if i am wrong anywhere.
Secondly we see the price have touched the upper blue parallel line and price have come done.
Thirdly we can see the weekly RSI is almost going to touch the RSI trend line, we can expect the RSI to go down from here.
Fourthly the weekly candle stick is showing a sign of downward movement.
So over all gold price seems to be bearish.
I dont know if i am right or wrong, this is what i see in my chart. I would like senior member to correct me if i am wrong anywhere.
Attached Image (click to enlarge)