The last time there was a Large Symmetrical triangle on the daily
It broke bullish
The price had been HIGH and then Declined to about 1050 if I am remembering
correctly, it is posted in the first post of this thread
Links POST 1
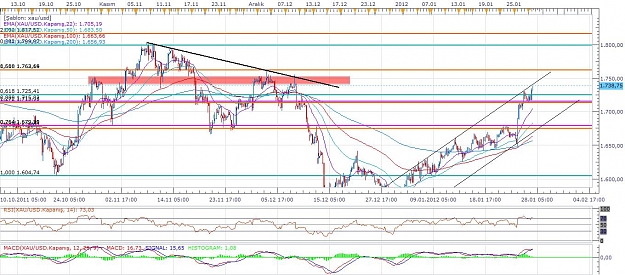
PRICE made high at 1222. Bottomed out at 1050 - then formed a long triangle.
See the chart, it's easier to understand than this one.
THen AT 1100 appx it broke.
The reason why I am mentioning continued reversal in price is due to past triangles. Patterns often repeat and sometimes create smaller patterns afterwards called orphans. (like the kids)
Now if the measure of the width was appx 1050 to 1250 lets just say to make it easier = (200 USD)- our target from the point of BREAK of the triangle price would be 200 USD higher so 1300 from 1100 break.
HERE is an Explanation of the new triangle
http://www.forexfactory.com/showthre...02#post5329702
In the simplest terms I can explain it to you
The triangle always forms pointing from Left to right
BECAUSE
The price moves from left to right
So you take the Width of the right side in price say - 400 USD
and use that to measure an approximate target.
FROM the POINT of BREAKOUT possibly after a test
HOW TO PLAY SYMMETRICAL TRIANGLES TO MAKE MONEY.
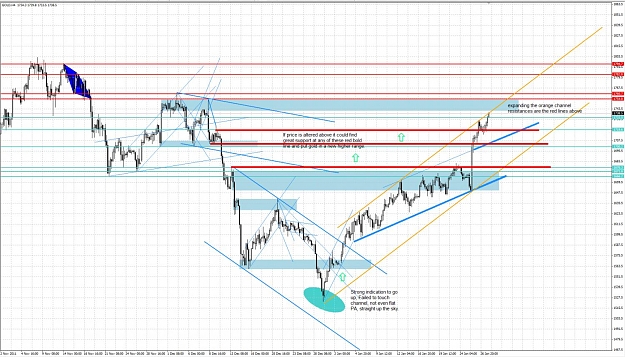
A. if you want to play the pattern safe, you set an order over the top of the triangle
-- breakout trading
B. If you are more aggressive you play it from the bottom or middle in line with what you feel the result will be
IT helps TO use the Recent Price Action and The PREVAILING TREND.
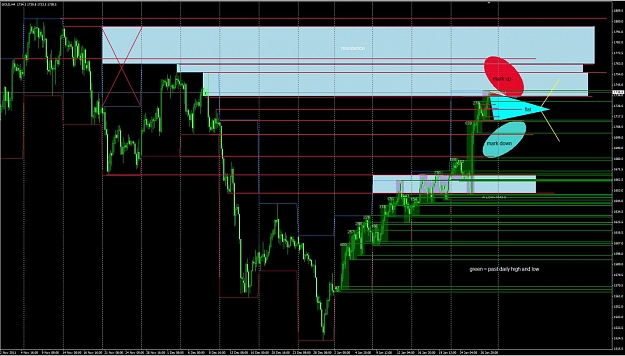
This is done after the move has usually
1. Broken the resistance line
2. Tested it
3. Moved either higher or lower (Bullish or Bearish)
4. Or a decisive breakout or both
It broke bullish
The price had been HIGH and then Declined to about 1050 if I am remembering
correctly, it is posted in the first post of this thread
Links POST 1
PRICE made high at 1222. Bottomed out at 1050 - then formed a long triangle.
See the chart, it's easier to understand than this one.
THen AT 1100 appx it broke.
The reason why I am mentioning continued reversal in price is due to past triangles. Patterns often repeat and sometimes create smaller patterns afterwards called orphans. (like the kids)
Now if the measure of the width was appx 1050 to 1250 lets just say to make it easier = (200 USD)- our target from the point of BREAK of the triangle price would be 200 USD higher so 1300 from 1100 break.
HERE is an Explanation of the new triangle
http://www.forexfactory.com/showthre...02#post5329702
In the simplest terms I can explain it to you
The triangle always forms pointing from Left to right
BECAUSE
The price moves from left to right
So you take the Width of the right side in price say - 400 USD
and use that to measure an approximate target.
FROM the POINT of BREAKOUT possibly after a test
HOW TO PLAY SYMMETRICAL TRIANGLES TO MAKE MONEY.
A. if you want to play the pattern safe, you set an order over the top of the triangle
-- breakout trading
B. If you are more aggressive you play it from the bottom or middle in line with what you feel the result will be
IT helps TO use the Recent Price Action and The PREVAILING TREND.
This is done after the move has usually
1. Broken the resistance line
2. Tested it
3. Moved either higher or lower (Bullish or Bearish)
4. Or a decisive breakout or both
XAU-XAG/USD_Gold n Silver Trader's Thread = Technicals, Fundamentals & News