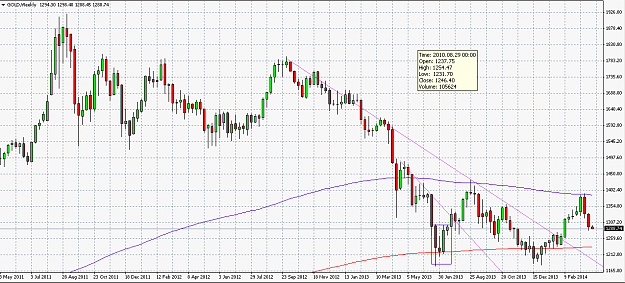
Disliked{quote} Hi All. As you can see from the charts below, 1) on 4 Hour : market is consolidating (nor up nor down) between 1297.19 and 1291.43, 2) on 8 Hour : market indicates Bullish pressure (Blue "L" shape in left hand column) between 1292.10 and 1298.14. Note : Bullish pressure is maintained even if the market goes below 1292.10 as long as it remains above 1289.25. Market is reversed (i.e. Bearish) only if market breaks below Demand @1291.47. 3) on Day : market indicates Bearish pressure (Redish Pink or Pinkish Red inverted "L" shape in left hand...Ignored
- Post #5,162
- Quote
- Mar 31, 2014 9:21am Mar 31, 2014 9:21am
- | Commercial Member | Joined Aug 2007 | 6,072 Posts
Hello World!
- Post #5,163
- Quote
- Mar 31, 2014 9:23am Mar 31, 2014 9:23am
- | Commercial Member | Joined Feb 2014 | 1,077 Posts
Using the FIA, traders need only "Sell the Highs" & "Buy the Lows".
- Post #5,164
- Quote
- Mar 31, 2014 9:24am Mar 31, 2014 9:24am
- | Joined Mar 2014 | Status: Noob Trader | 723 Posts
- Post #5,166
- Quote
- Mar 31, 2014 9:33am Mar 31, 2014 9:33am
- | Joined Feb 2014 | Status: Member | 74 Posts
- Post #5,168
- Quote
- Mar 31, 2014 9:50am Mar 31, 2014 9:50am
- | Joined Jul 2013 | Status: Member | 1,494 Posts
A trade should be based on an assumption based on facts
- Post #5,169
- Quote
- Mar 31, 2014 10:12am Mar 31, 2014 10:12am
- | Commercial Member | Joined Feb 2014 | 1,077 Posts
Using the FIA, traders need only "Sell the Highs" & "Buy the Lows".
- Post #5,170
- Quote
- Mar 31, 2014 10:22am Mar 31, 2014 10:22am
- | Commercial Member | Joined Feb 2014 | 1,077 Posts
Using the FIA, traders need only "Sell the Highs" & "Buy the Lows".
- Post #5,171
- Quote
- Mar 31, 2014 10:29am Mar 31, 2014 10:29am
- | Commercial Member | Joined Aug 2007 | 6,072 Posts
Hello World!
- Post #5,173
- Quote
- Mar 31, 2014 10:39am Mar 31, 2014 10:39am
- | Commercial Member | Joined Feb 2014 | 1,077 Posts
Using the FIA, traders need only "Sell the Highs" & "Buy the Lows".
- Post #5,175
- Quote
- Mar 31, 2014 10:45am Mar 31, 2014 10:45am
- | Commercial Member | Joined Aug 2007 | 6,072 Posts
Hello World!
- Post #5,176
- Quote
- Mar 31, 2014 10:46am Mar 31, 2014 10:46am
- | Commercial Member | Joined Feb 2014 | 1,077 Posts
Using the FIA, traders need only "Sell the Highs" & "Buy the Lows".
- Post #5,177
- Quote
- Mar 31, 2014 10:50am Mar 31, 2014 10:50am
- | Commercial Member | Joined Feb 2014 | 1,077 Posts
Using the FIA, traders need only "Sell the Highs" & "Buy the Lows".
- Post #5,180
- Quote
- Mar 31, 2014 11:15am Mar 31, 2014 11:15am
- | Joined Mar 2014 | Status: Noob Trader | 723 Posts