• Home
  • Forums
  • News
  • Calendar
  • Market
  • Login
  • Join
  • User/Email: Password:
  • 4:45pm
Menu
  • Forums
  • News
  • Calendar
  • Market
  • Login
  • Join
  • 4:45pm
Sister Sites
  • Energy EXCH
  • Crypto Craft
  • Forex Factory

Options

Bookmark Thread

First Page First Unread Last Page Last Post

Print Thread

Similar Threads

Trading with range bars ichimoku cloud & awesome oscillator 4,314 replies

Ichimoku cloud burst ea 1,145 replies

Anyone using Ichimoku Cloud for trading? 2 replies

The Ichimoku Cloud 4 replies

  • Trading Journals
  • /
  • Reply to Thread
  • Subscribe
  • 52
Attachments: TT Ichimoku Cloud Trading Analysis with Trading Calls
Exit Attachments
Tags: TT Ichimoku Cloud Trading Analysis with Trading Calls
Cancel

TT Ichimoku Cloud Trading Analysis with Trading Calls

  • Last Post
  •  
  • Page 1 2
  • Page 1 2
  •  
  • Post #1
  • Quote
  • First Post: Edited Nov 2, 2016 12:29pm Oct 27, 2016 11:46pm | Edited Nov 2, 2016 12:29pm
  •  TalentTrader
  • | Joined May 2016 | Status: Member | 37 Posts
Hi Everyone,

This will be my very first trade journal. All the future posts will primarily be my thoughts and it is not meant for you guys to trade upon. If you should do so, it would be at your own risk. I must also say that I currently only have about 3 years of live trading experience. I am currently being mentored by a really nice lady, but until I become consistently profitable, I would not mention her so as not to shame her or dishonor her skills and belief in me.

For anyone that wishes to share their thoughts with me, please do so and I will gladly share my views with you. But at the same time, I do recognize that we may, more often than not, agree to disagree. Yet, I will defend your right and mine to express our own views and opinions. My trading details are below for anyone that also wishes to compare their trading calls and ideas with mine:

Broker: Oanda Asia Pacific
Timezone: +8Hrs GMT (Singapore)
Asset Class Traded: CFDs and FX - Hopefully get into futures full time too
Instruments Currently Traded: Brent Crude Oil, Major FX pairs
Timeframe: Mainly Daily, 4H, 1H, 30M. Sometimes 15M.
Note: Charts may sometimes look different as I trade on my Mobile (Oanda's mobile platform) and Desktop (Motivewave).

Legend:
Immediate Support level => Support 1 (S1)
Subsequent Support level => Support 2 (S2)
Immediate Resistance level => Resistance 1 (R1)
Subsequent Resistance level => Resistance 2 (R2)
Very Bullish => ++
Bullish => +
Neutral => NA
Bearish => -
Very Bearish => --

Thanks everyone for reading. I hope I can help you guys in any small ways.

God Bless.
Talent Trader
  • Post #2
  • Quote
  • Edited 1:37am Oct 28, 2016 12:06am | Edited 1:37am
  •  TalentTrader
  • | Joined May 2016 | Status: Member | 37 Posts
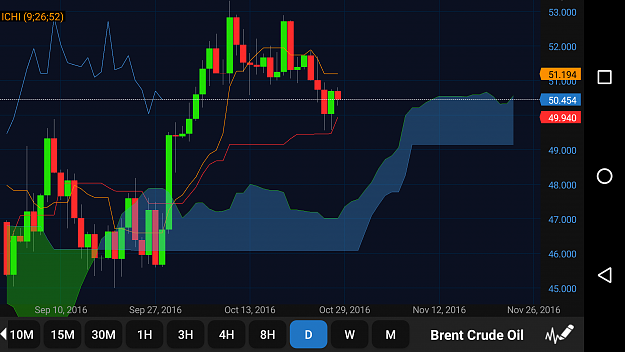
Brent Crude - 28 Oct 2016

Attached Image (click to enlarge)
Click to Enlarge

Name: Screenshot_20161028-D.png
Size: 117 KB

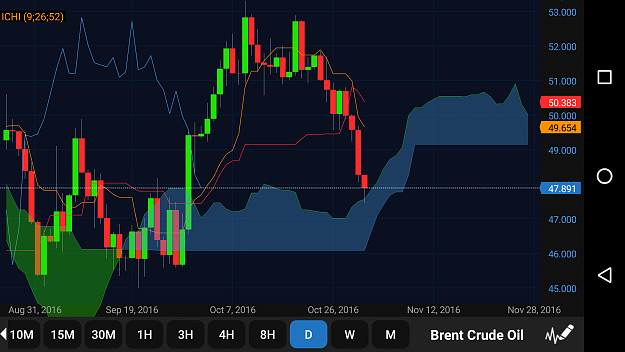
For the Daily Chart:
- Cloud has a flat bottom, yet cloud is bullish and seems to be moving upwards
- Price, Tenkan, Kijun and Chikou are all above the cloud
- Kijun is upwards sloping
- Tenkan is flat and above kijun. It is good to note that price has been closing below tankan
- Resistance 1 @ 51.02 based on chikou
- Timeframe outlook: Bullish +

Attached Image (click to enlarge)
Click to Enlarge

Name: Screenshot_20161028-4H.png
Size: 111 KB

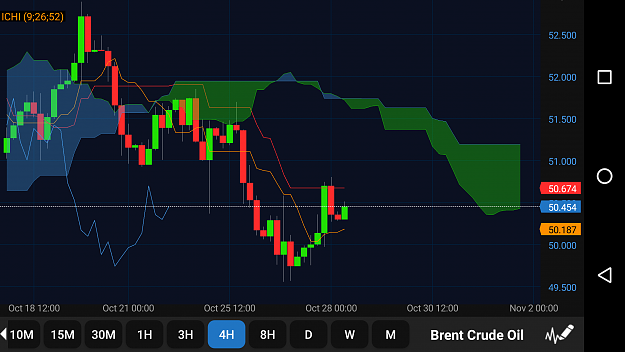
4H Chart:
- Cloud has a flat top and is bearish
- Price, Tenkan, Kijun and Chikou are all below the cloud
- Kijun is flat @ 50.674
- Tenkan is below kijun but has a gentle upwards sloping gradient. It is good to note that price is above the Tenkan
- Support 1 @ 50.28
- Timeframe outlook: Bearish -

Attached Image (click to enlarge)
Click to Enlarge

Name: Screenshot_20161028-1H.png
Size: 112 KB

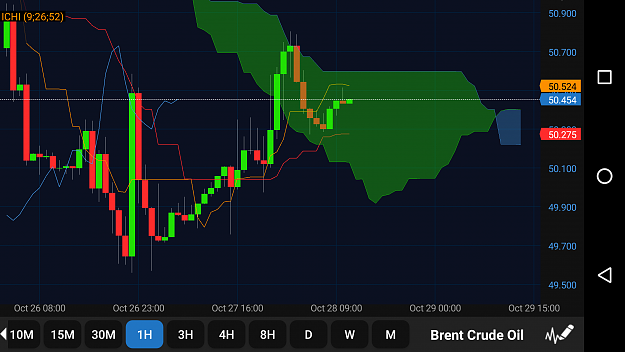
1H Chart:
- Cloud has turned from bearish to bullish, though there seems to be a slight dip
- Price, Tenkan and Kijun are in the cloud.
- Chikou is still below the cloud.
- Tenkan is above kijun but seems to be flat and abit downwards sloping. It is good to note that price has closed below Tenkan.
- Kijun seems to be becoming flat. A flat kijun tends to attract price.
- Resistance 1 @50.524; Resistance 2 @ Top of cloud
- Support 1 @50.300; Support 2 @ 50.275
- Timeframe outlook: Neutral NA

Attached Image (click to enlarge)
Click to Enlarge

Name: Screenshot_20161028-30M.png
Size: 122 KB

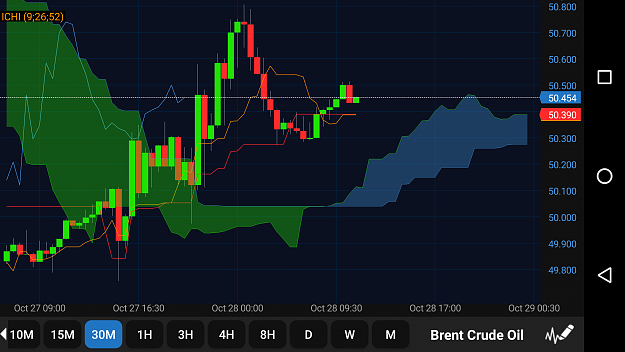
30M Chart
- Cloud is bullish but there seems to be a slight dip before going flat
- Price, Tenkan, Kijun and Chikou are all above cloud.
- Chikou seems to be meeting resistance soon with the candlestick
- Tenkan has crossed below kijun from above and is now moving parallen to kijun. It is good to note that price has closed above both kijun and tankan.
- Kijun is flat.
- Support 1 @50.390; Support 2 @ 50.300
- Reistance 1 @50.500; Resistance 2 @ 50.750
- Timeframe outlook: Bullish +

Overall outlook: Bullish NA
 
 
  • Post #3
  • Quote
  • Edited Nov 2, 2016 1:58am Nov 1, 2016 3:03am | Edited Nov 2, 2016 1:58am
  •  TalentTrader
  • | Joined May 2016 | Status: Member | 37 Posts
Brent Crude (BCO/USD) - 1 Nov 2016 @ 11am
Â
Attached Image (click to enlarge)
Click to Enlarge

Name: Screenshot_20161101-112739.png
Size: 124 KB

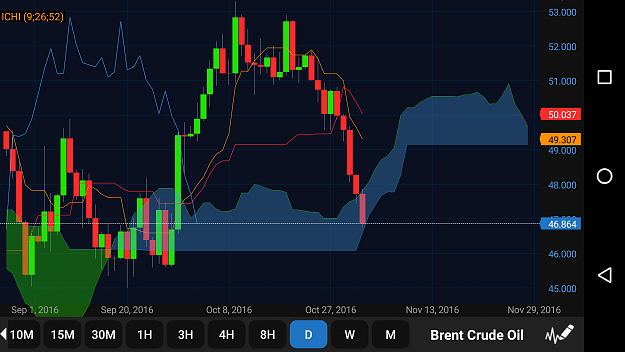
Daily Chart:
- Cloud is generally bullish but has a slight dip as projected in the future. Good to note that cloud is also flat @ 49.115
- Price, Tenkan + kijun, chikou are all above cloud
- Tenkan has crossed below kijun from above
- Both tenkan and kijun are downwards sloping
- Price closed below tenkan but rebounded off the cloudÂÂ
- Chikou meeting resistance at tenkan
- S1 @ 47.630
- R1 @ 49.115
Time frame outlook : Bullish +
Â
Attached Image (click to enlarge)
Click to Enlarge

Name: Screenshot_20161101-113337.png
Size: 147 KB

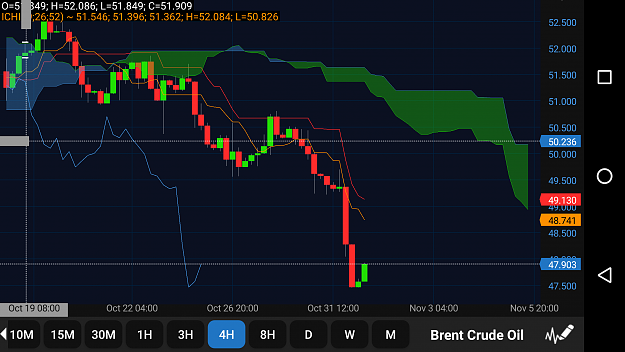
4HR Chart:
- Cloud is bearish and is downwards sloping
- Price, Tenkan + Kijun, ÂÂChikou are all below cloud
- Tenkan is below kijun. Good to note that price has closed below tenkan
- Price has a pullback @ 47.459
- S1 @ 47.459
- R1 @ 48.741; R2 @ 49.130 [Kijun]ÂÂ
Time frame outlook : Bearish -
Â
Attached Image (click to enlarge)
Click to Enlarge

Name: Screenshot_20161101-114029.png
Size: 139 KB

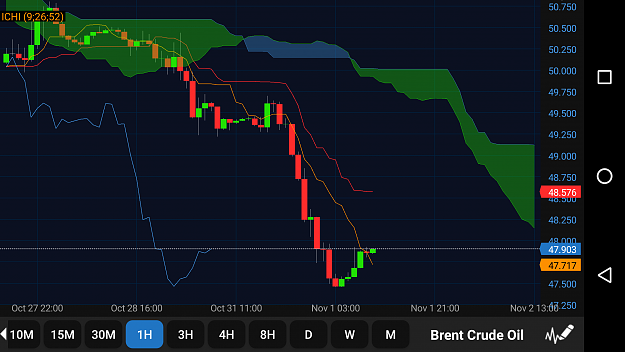
1HR Chart:
- Cloud is bearish and downwards sloping
- Price, Tenkan + Kijun, ÂÂChikou are all below the cloud
- Tenkan is below Kijun
- Kijun is becoming flat @ 48.576. Flat kijun attracts price.
- Price has opened above the Tenkan
- S1 @ 47.459
- R1 @ 48.576 [Kijun] ; R2 @ 49.142 [top of cloud]ÂÂ
Time frame outlook : Bearish NA
Â
Attached Image (click to enlarge)
Click to Enlarge

Name: Screenshot_20161101-114531.png
Size: 131 KB

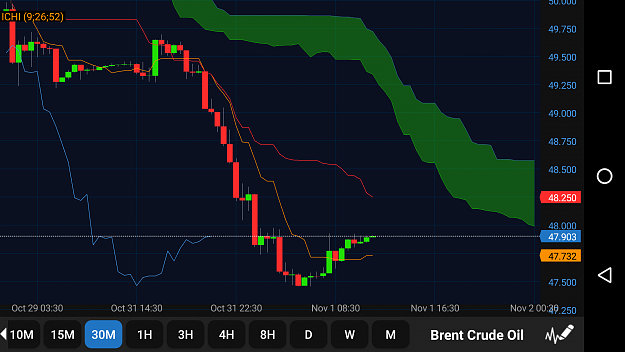
30Min Chart:
- Cloud is bearish and downwards slopingÂÂ
- Price , Tenkan + Kijun, Chikou are all below cloud
- Tenkan is also below Kijun. Good to note that price has consistently closed above Tenkan.ÂÂ
- S1 @ 47.732 [Tenkan] ; S2 @ 47.453
- R1 @ 48.250 [Kijun] ; R2 @ 48.562 [Top of Cloud]ÂÂ
Time frame outlook : Bearish NA
Â
Conclusion: Overall, bearish day. I will wait for price to move closer to the flat Kijun on the 1hr chart then enter a short position. Another idea to consider would be to enter long now, when price nears the flat kijun on the 1hr chart, close the long position and enter a short position .ÂÂ
 
 
  • Post #4
  • Quote
  • Nov 2, 2016 2:09am Nov 2, 2016 2:09am
  •  TalentTrader
  • | Joined May 2016 | Status: Member | 37 Posts
So last night, at 12am, I entered a short for BCO/USD. As suggested, I waited for price to move closer to the flat kijun before entering a short position. Details are found below:

  1. Shorted 2 units @ 47.674
  2. SL @ 48.320
  3. TP @ 46.859


  • Post #5
  • Quote
  • Nov 2, 2016 2:28am Nov 2, 2016 2:28am
  •  TalentTrader
  • | Joined May 2016 | Status: Member | 37 Posts
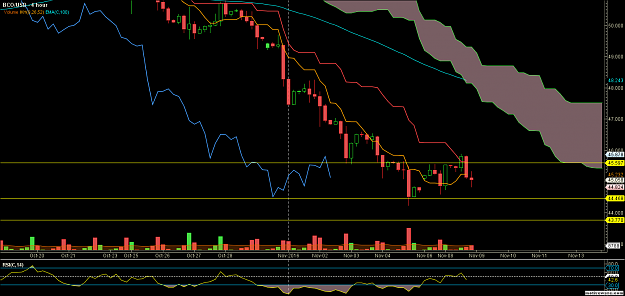
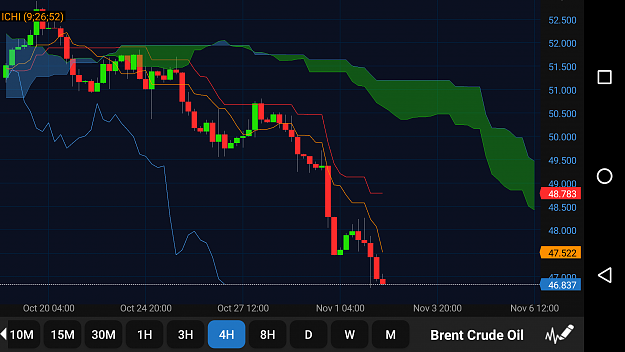
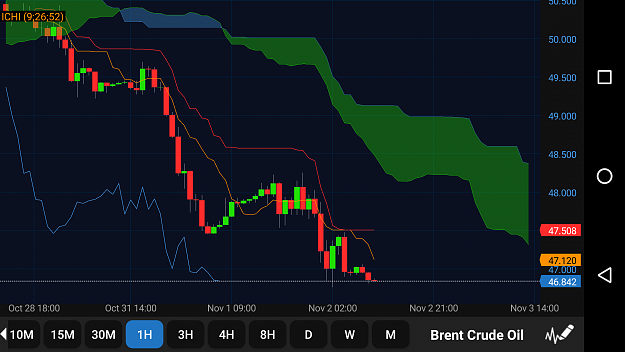
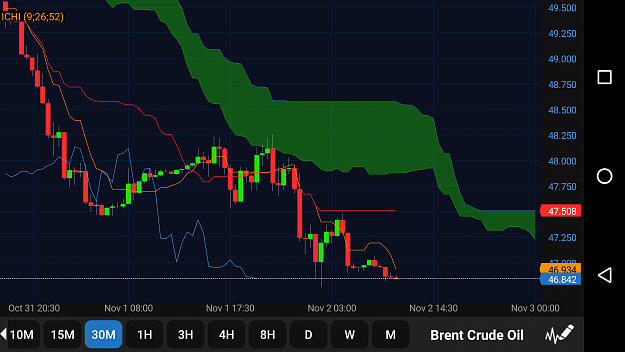
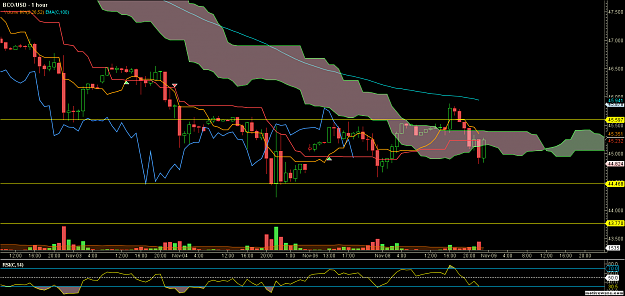
Brent Crude (BCO/USD) - 2 Nov 2016 @ 11am
Attached Image (click to enlarge)
Click to Enlarge

Name: Screenshot_20161102-111105.png
Size: 121 KB

Daily Chart:

  1. There is a dip in the cloud with a flat bottom @ 49.158
  2. Tenkan + Kijun are still above the cloud. Both sharply downwards sloping.
  3. Price is now in the cloud. So is Chikou
  4. Price is also now below Tenkan.
  5. Tenkan is below Kijun
  6. S1 @ 46.100 [Bottom level of past cloud] ; S2 @ 45.650
  7. R1 @ 49.158 [current cloud bottom] ; R2 @ 50.027 [Chikou]
  8. Time frame outlook : Bearish -

Attached Image (click to enlarge)
Click to Enlarge

Name: Screenshot_20161102-112005.png
Size: 124 KB

4HR Chart:

  1. Cloud is bearish and moving further downwards
  2. Price, T + K, Chikou are all below cloud
  3. Tenkan is below kijun and has a steep downwards slope
  4. Kijun is flat (price is normally attracted to a flat kijun)
  5. Price is below Tenkan
  6. S1 @ 46.582 ; S2 @ 45.679
  7. R1 @ 47.417 [Chikou] ; R2 @ 48.000 ; R3 @ 48.783 [Kijun]
  8. Time frame outlook : Bearish --

Attached Image (click to enlarge)
Click to Enlarge

Name: Screenshot_20161102-112553.png
Size: 116 KB

1HR Chart:

  1. Cloud is bearish ; Fat and downwards sloping
  2. Price , T+K, Chikou are all below cloud
  3. Tenkan is below kijun and is downwards sloping
  4. Kijun is flat and price is below tenkan
  5. We are at a recent low; No nearby support levels
  6. R1 @ 47.120 [Tenkan] ; R2 @ 47.508 [Kijun]
  7. Time frame outlook : Bearish --

Attached Image (click to enlarge)
Click to Enlarge

Name: Screenshot_20161102-112940.png
Size: 131 KB

30Min Chart:

  1. Cloud is bearish; seems to be getting wider with flat top @ 47.508. Cloud seems to also be having a flat bottom.
  2. Price, T+K, Chikou are all below cloud
  3. Tenkan is below Kijun and is starting to become flat
  4. Kijun is flat
  5. Price is below Tenkan
  6. We are at a recent low with no nearby support level
  7. R1 @ 46.934 [Tenkan] ; R2 @ 47.234 [Chikou] ; R3 @ 47.508 [Kijun]
  8. Time frame outlook : Bearish --

Conclusion: Look for price to move closer to the flat kijun on 4hr, 1hr and 30min chart. Once that happens, we can enter a short position.
Note also that for all time frames, price is below tenkan. Perhaps to also check RSI as a confirmation for price if it is oversold?


  • Post #6
  • Quote
  • Edited 11:47am Nov 2, 2016 5:53am | Edited 11:47am
  •  TalentTrader
  • | Joined May 2016 | Status: Member | 37 Posts
Update for BCO/USD @ 5PM 2 Nov 2016

Because price did not pullback back to the flat kijun on all time frames, but instead trended downwards, I have decided to enter a short position. Details are as follows:

  1. Shorted 2 units of BCO @ 46.536
  2. SL @ 47.500 - Based on 1HR flat Kijun
  3. TP @ 45.679 - Based on 4HR S2 level
  4. Risk Reward Ratio is 1:1

*Update*
At 10:30PM, at the release of the EIA Crude Oil Stocks Change report, my TP was hit. Thank God!


  • Post #7
  • Quote
  • Nov 2, 2016 6:30am Nov 2, 2016 6:30am
  •  SnoopyAKQJT
  • | Joined Sep 2010 | Status: Member | 517 Posts
Quoting TalentTrader
Disliked
Update for BCO/USD @ 5PM 2 Nov 2016 Because price did not pullback back to the flat kijun on all time frames, but instead trended downwards, I have decided to enter a short position. Details are as follows: Shorted 2 units of BCO @ 46.536 SL @ 47.500 - Based on 1HR flat Kijun TP @ 45.679 - Based on 4HR S2 level Risk Reward Ratio is 1:1
Ignored
Crude oil (WTI) inventory report is due at 1030am NY time (1030pm your time, I think). Would you be out of the trade by then if price hasn't yet hit TP ?
(I am not familiar with Brent, maybe this report won't even have any effect on Brent).
 
 
  • Post #8
  • Quote
  • Nov 2, 2016 11:45am Nov 2, 2016 11:45am
  •  TalentTrader
  • | Joined May 2016 | Status: Member | 37 Posts
Quoting SnoopyAKQJT
Disliked
{quote} Crude oil (WTI) inventory report is due at 1030am NY time (1030pm your time, I think). Would you be out of the trade by then if price hasn't yet hit TP ? (I am not familiar with Brent, maybe this report won't even have any effect on Brent).
Ignored
Hi snoopy, the report does have an effect on Brent. Afterall WTI also does have implications on Brent. However, as you will see in my updated post on #post 6, i actually hit my TP when the news was released. I say it would be due to partly luck, we both know the trade could have gone either way. But i put my analysis there, i did my job, i took a decision, and I stuck to it. So it paid off.

Hope this helps. And thanks for your question!
 
1
  • Post #9
  • Quote
  • Nov 2, 2016 12:27pm Nov 2, 2016 12:27pm
  •  TalentTrader
  • | Joined May 2016 | Status: Member | 37 Posts
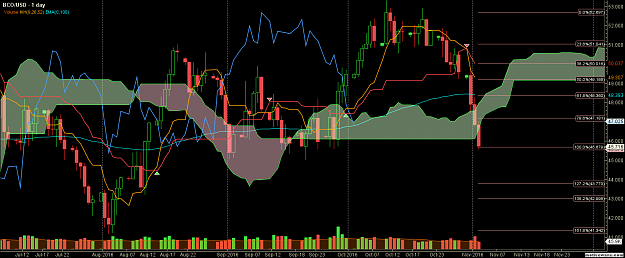
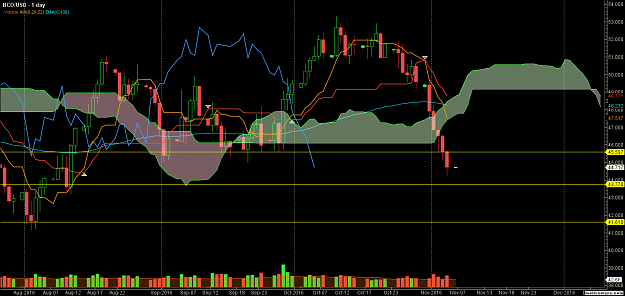
Brent Crude (BCO/USD) - 2 Nov 2016 @ 11PM

Attached Image (click to enlarge)
Click to Enlarge

Name: BCOUSD - Primary Analysis - Nov-03 0001 AM (1 day).png
Size: 111 KB

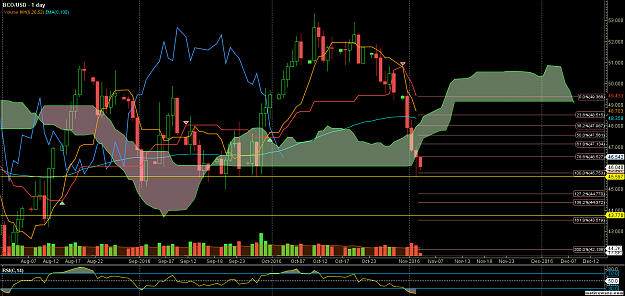
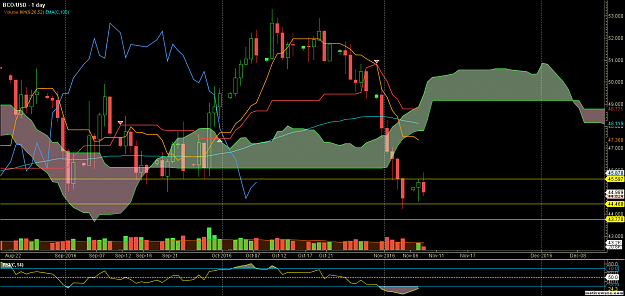
Daily Chart:

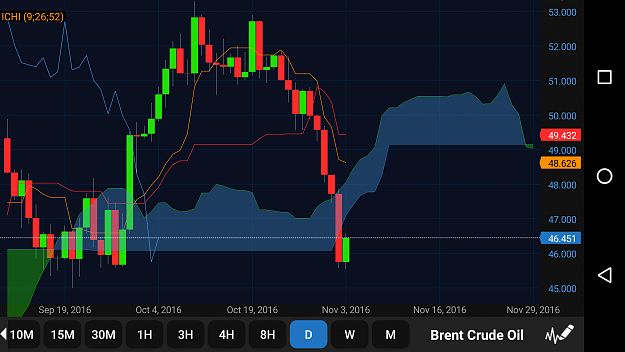
  1. There is a dip in the cloud with a flat bottom @ 49.167. The dip in cloud now is made alot clearer as compared to this morning
  2. Price and Chikou have come out of the cloud. This signifies bearishness
  3. Tenkan and Kijun are also downwards sloping. Tenkan has crossed Kijun from above.
  4. There is an additional indicator here using the 100EMA. Price has also crossed and closed below the 100 EMA, which shows that there is a strong downwards trending movement (The EMA here just serves as a confirmation of sorts)
  5. S1 @ 45.597 [Bottom of the past nearest candlestick bars] ; S2 @ 43.770 [127.2% Fib extension level]
  6. R1 @ 46.100 [Previous Support level has now become resistance] ; R2 @ 48.393 [100EMA] ; R3 @ 49.307 [Tenkan]
  7. Time frame outlook : Bearish --

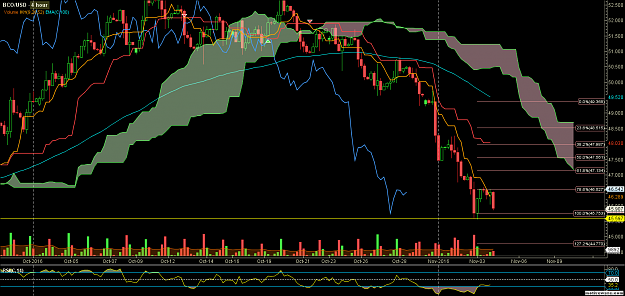
Attached Image (click to enlarge)
Click to Enlarge

Name: BCOUSD - Primary Analysis - Nov-02 2351 PM (4 hour).png
Size: 91 KB

4HR Chart:

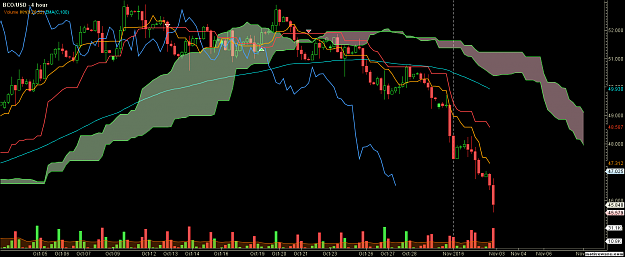
  1. Cloud is very bearish. Clearly and strongly moving downwards.
  2. Price, Tenkan + Kijun, Chikou are all below the cloud.
  3. Tenkan is below Kijun and both Tenkan and Kijun are strongly downwards sloping.
  4. Price has consistently closed below the tenkan. There are long closing bodies which signifies strong seller momentum.
  5. There are no immediate support levels and I believe we have reached a recent low in the market. If I had to give a support level, it would be based on the low prices back in Sept 2016. S1 @ 45.550 [Sept Chikou] ; S2 @ 45.300 [Previous Chikou]
  6. R1 @ 46.917 [Tenkan] ; R2 @ 47.438 [Chikou Sharp Valley]
  7. Time frame outlook : Bearish --

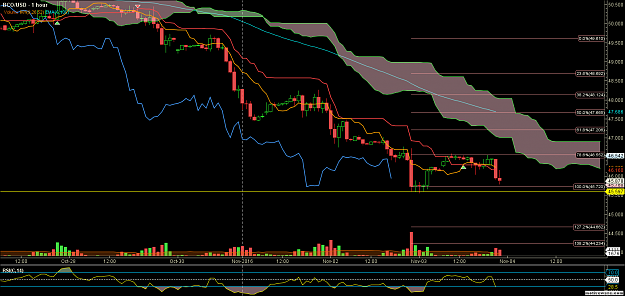
Attached Image (click to enlarge)
Click to Enlarge

Name: BCOUSD - Primary Analysis - Nov-02 2352 PM (1 hour).png
Size: 72 KB

1HR Chart:

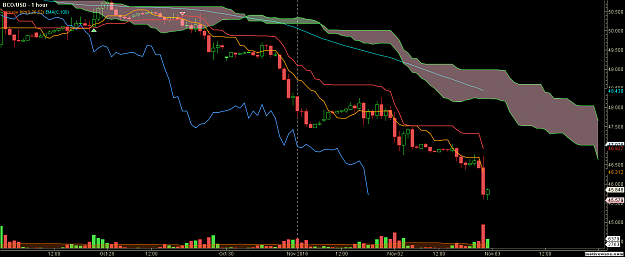
  1. Cloud is bearish and also downwards sloping. However we see that cloud seems to have a flat top and bottom forming.
  2. Price, Tenkan + Kijun, Chikou are all below the cloud.
  3. Tenkan is below the Kijun. It is good to note that both Tenkan and Kijun seems to be flattening out.
  4. Price has closed below Tenkan.
  5. There seems to be a very weak pullback of price after the EIA news release
  6. Again, there are no immediate support levels and I believe we have reached a recent low in the market
  7. R1 @ 46.302 [Tenkan] ; R2 @ 46.833 [Price was consolidating sideways] ; R3 @ 46.917 [Kijun]
  8. Time frame outlook : Bearish -

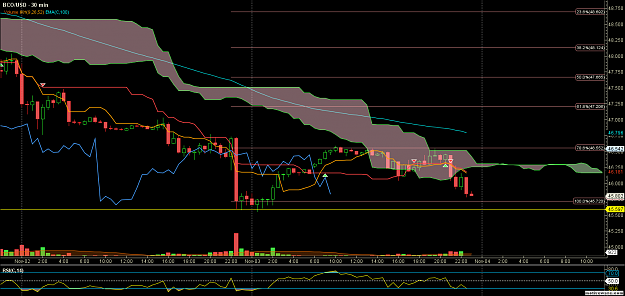
Attached Image (click to enlarge)
Click to Enlarge

Name: BCOUSD - Primary Analysis - Nov-02 2352 PM (30 min).png
Size: 77 KB

30M Chart:

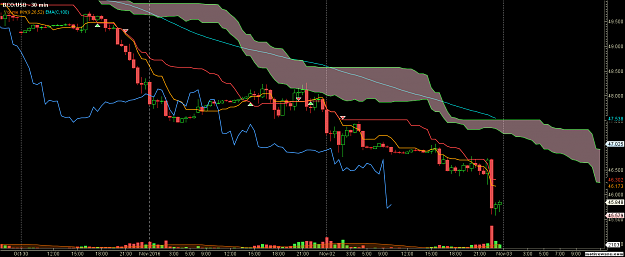
  1. Cloud is bearish. It is flattening out though. We can see that it is developing sideways with a flat top and bottom.
  2. Price, Tenkan + Kijun, Chikou are all below the cloud.
  3. Tenkan is below the Kijun. Both Tenkan and Kijun are parallel and are flat.
  4. Price is below the Tenkan.
  5. Like the previous 3 timeframes mentioned above, there is no immediate support. Price is now moving sideways after the EIA news release. If I had to give a support level, it would be S1 @ 45.708 [Chikou Valley at about 9.30pm]
  6. R1 @ 46.173 [Tenkan] ; R2 @ 46.302 [Kijun]; R3 @ 46.724 [Chikou Peak Coinciding with flat Kijun]
  7. Time frame outlook : Bearish -


Conclusion: Seeing how price seems to be moving sideways now on both the 4HR and 1HR chart, also, on the 4HR and 1HR chart, both Kijun and Tenkan are flat, it probably means that price will be consolidating in the short term time frame (sideways moving). Now that the EIA news is out, the traders will probably have to re-adjust their positions once again. Market is taking a break and price will probably continue in the direction of the bearish trend again. A quick check on the RSI will show that on the 30M, 1HR and 4HR charts, price is at the oversold region. Then again, this is to always be expected during trending phase of the market. I will personally wait and see how price moves tomorrow since we already very near the S1 level on the daily.


  • Post #10
  • Quote
  • Edited 10:16am Nov 3, 2016 3:03am | Edited 10:16am
  •  TalentTrader
  • | Joined May 2016 | Status: Member | 37 Posts
Brent Crude (BCO/USD) - 2 Nov 2016 @ 11AM

Attached Image (click to enlarge)
Click to Enlarge

Name: Screenshot_20161103-110311.png
Size: 118 KB

Daily Chart:

  1. Cloud has twisted and is no bearish with a flat top @ 49.142
  2. Price is below cloud and has retraced off yesterday's S1 @ 45.597
  3. Chikou is back in cloud
  4. Tenkan and Kijun are above cloud
  5. Tenkan is less downwards sloping, while kijun is now flat
  6. S1 @ 45.597
  7. R1 @ 47.430 [Sep 26 Flat Kijun] ; R2 @ 48.626 [Tenkan]
  8. Time frame outlook : Neutral NA

Attached Image (click to enlarge)
Click to Enlarge

Name: Screenshot_20161103-110318.png
Size: 120 KB

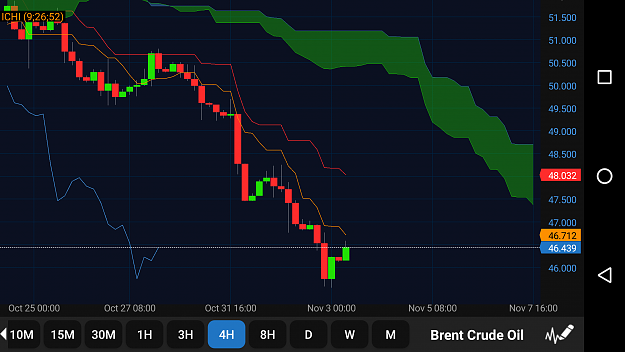
4HR Chart:

  1. Cloud is bearish with a flat top @ 48.700
  2. Price, Tenkan + Kijun, Chikou are all below cloud
  3. Tenkan and Kijun are downwards sloping.
  4. Tenkan is below Kijun. Good to note that while price has rebounded, it is still below Tenka
  5. S1 @ 45.743 [Chikou Valley]
  6. R1 @ 46.712 [Tenkan] ; R2 @ 47.450 [Chikou] ; R3 @ 48.032 [Kijun]
  7. Time frame outlook : Bearish --

Attached Image (click to enlarge)
Click to Enlarge

Name: Screenshot_20161103-110326.png
Size: 119 KB

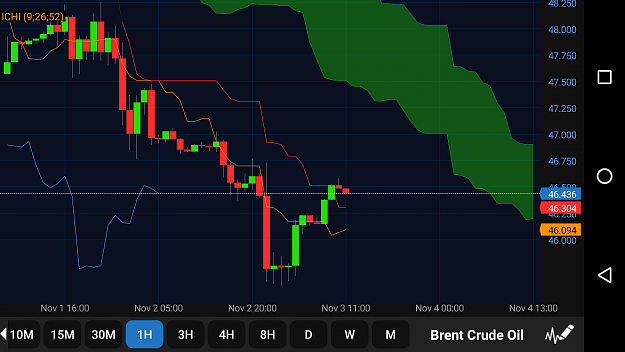
1HR Chart:

  1. Cloud is bearish, though it seems to have become upwards sloping
  2. Price, Tenkan + Kijun, Chikou are all below cloud
  3. Tenkan is starting to be downwards sloping.
  4. Tenkan is below Kijun
  5. Price however, has closed above the Kijun
  6. Kijun is flat @ 46.304
  7. S1 @ 46.304 [Kijun] ; S2 @ 46.094 [Tenkan] ; S3 @ 45.730 [Chikou]
  8. R1 @ 46.842 [Sideways price level] ; R2 @ 47.000 [Flat bottom of cloud]
  9. Time frame outlook : Bearish NA

Attached Image (click to enlarge)
Click to Enlarge

Name: Screenshot_20161103-110337.png
Size: 111 KB

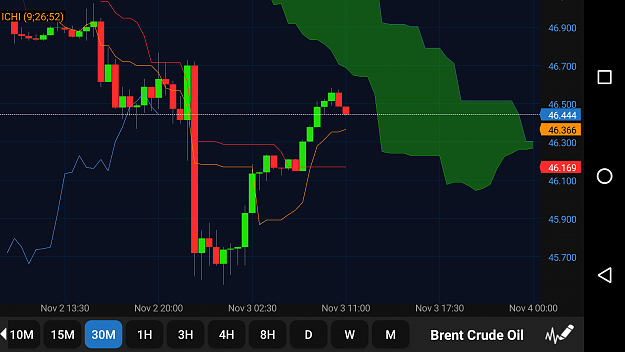
30M Chart:

  1. Cloud is still bearish. However, it has narrowed a lot and has a flat top.
  2. Price, Tenkan + Kijun, Chikou are all below the cloud
  3. Tenkan has crossed above Kijun
  4. Kijun is flat @ 46.169
  5. Price is above Tenkan which is also above Kijun
  6. Chikou is meeting resistance in price
  7. S1 @ 46.366 [Tenkan] ; S2 @ 46.169 [Kijun]
  8. R1 @ 46.642 [Bottom of recent cloud] ; R2 @ 46.714 [Chikou Peak]
  9. Time frame outlook : Bearish NA


Conclusion: Trend seems to have ended. But I will wait and see if this is really the exhaustion of the trend, or is it in fact just a consolidation before a bigger push in the direction of the trend.


  • Post #11
  • Quote
  • Nov 3, 2016 11:00am Nov 3, 2016 11:00am
  •  TalentTrader
  • | Joined May 2016 | Status: Member | 37 Posts
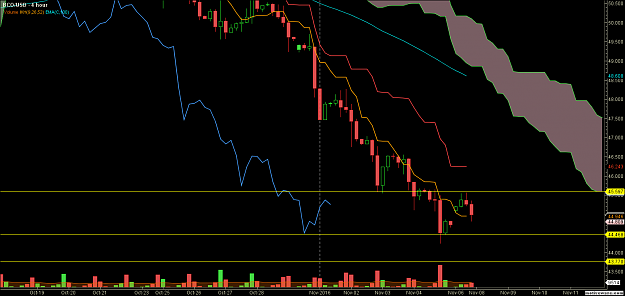
Brent Crude (BCO/USD) - 2 Nov 2016 @ 10PM

Attached Image (click to enlarge)
Click to Enlarge

Name: BCOUSD - Primary Analysis - Nov-03 2234 PM (1 day).png
Size: 116 KB

Daily Chart:

  1. Cloud has had little change from this morning. No surprise as this is the daily chart. Anyway, cloud has twisted and is bearish with a flat top @ 49.156
  2. Tenkan and Kijun are both above the cloud and are sharply sloping downwards. Tenkan and Kijun seem to be converging.
  3. Tenkan is still below Kijun. It is good to note that the 100EMA [long term trend] is also above the cloud.
  4. Chikou is in the cloud
  5. Price is below the cloud
  6. S1 @ 45.597 ; S2 @ 44.770 [127.2% Fib ext]
  7. R1 @47.134 [61.9% Fib ret level, which coincides with previous flat Kijun] ; R2 @ 47.987 [38.2% Fib Ret level]
  8. Time frame outlook : Bearish -

Attached Image (click to enlarge)
Click to Enlarge

Name: BCOUSD - Primary Analysis - Nov-03 2243 PM (4 hour).png
Size: 119 KB

4HR Chart:

  1. Cloud is bearish and is starting to widen. Cloud has a flat top @ 48.703
  2. Price, Tenkan + Kijun, Chikou are all below the cloud.
  3. Tenkan is below kijun and is downwards sloping.
  4. Kijun is flat @ 48.030
  5. Price has only recently cross the Tenkan.
  6. S1 @ 45.753 [100% Fib level] ; S2 @ 44.770 [127.2% Fib ext]
  7. R1 @ 46.527 [78.6% Fib ret] ; R2 @ 47.134 [61.9% Fib ret level] ; R3 @ 48.030 [kijun]
  8. Time frame outlook : Bearish -

Attached Image (click to enlarge)
Click to Enlarge

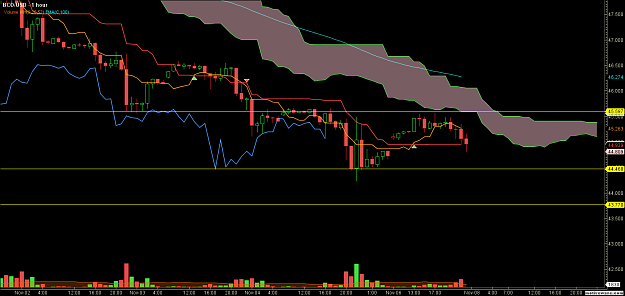
Name: BCOUSD - Primary Analysis - Nov-03 2250 PM (1 hour).png
Size: 93 KB

1HR Chart:

  1. Cloud is bearish but has flattened out with a flat top @ 46.904
  2. Price, Tenkan + Kijun, Chikou are all below cloud
  3. Tenkan is above Kijun, but seems to be dipping downwards, getting ready to cross below kijun.
  4. Kijun is flat @ 46.160
  5. Price has been range bound from between 45.720 to 46.552. This can be seen between the 100% and 78.6% Fib levels.
  6. S1 @ 45.720 [100% Fib level] ; S2 @ 44.662 [127.2% Fit ext level]
  7. R1 @ 46.552 [78.6% Fib ret level] ; R2 @ 46.904 [Flat top of cloud]
  8. Time frame outlook : Bearish NA

Attached Image (click to enlarge)
Click to Enlarge

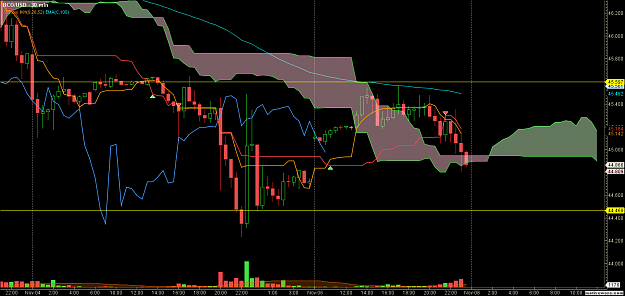
Name: BCOUSD - Primary Analysis - Nov-03 2301 PM (30 min).png
Size: 91 KB

30M Chart:

  1. Cloud is thin and has dipped quite substantially to become bearish.
  2. Tenkan + Kijun is in the cloud. Both are flat but might slope downwards.
  3. Chikou is upwards sloping and may meet resistance at the flat Kijun.
  4. Price is below cloud.
  5. Price has also been range bound. This goes to show the fractal nature of market and is similar to the range as mentioned in the 1HR chart.
  6. S1 @ 45.720 [100% Fib level]
  7. R1 @ 46.218 [Tenkan] ; R2 @ 46.516 [Flat top of cloud, near the 78.6% Fib level]
  8. Time frame outlook : Neutral -


Conclusion : I would actually wait and see to see if price will break the immediate support level at 45.720. I will also wait to ensure that for all the 4hr, 1hr and 30m chart, Tenkan must cross below Kijun and price must close below the tenkan to be sure that the downwards trend will continue. It is also good to note that RSI is only oversold on the Daily chart. The rest of the time frames, RSI is actually just above the oversold levels.

 
1
  • Post #12
  • Quote
  • Nov 6, 2016 10:46am Nov 6, 2016 10:46am
  •  TalentTrader
  • | Joined May 2016 | Status: Member | 37 Posts
Upcoming Week In Review:

I do not expect myself to be trading much this week. Because of the following 2 reasons:

  1. On Tues 8th Nov 2016, it would be the voting of the new president of the USA. Hilary or Trump. Frankly, I don't care, but the markets do. So it would be wise to not let my account get whipsawed.
  2. On Wed, there would be the EIA Crude Oil Stocks Change news. That would definitely impact the oil prices too.

If there is any trading to be done, it would most likely be done on Wed onwards.


Have a blessed week one and all! And to those friends in the States, vote wisely, vote rationally, vote as if your life depends on it.


  • Post #13
  • Quote
  • Nov 6, 2016 11:17am Nov 6, 2016 11:17am
  •  TalentTrader
  • | Joined May 2016 | Status: Member | 37 Posts
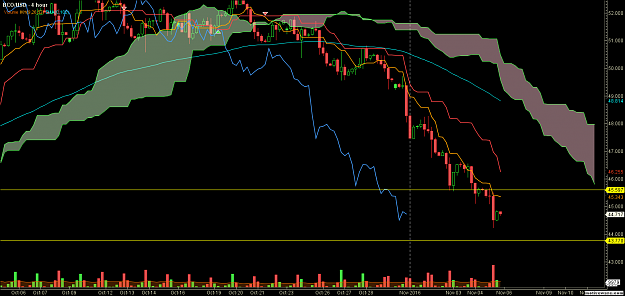
Brent Crude (BCO/USD) - 6 Nov 2016

Week In Review:
Well, for a greater part of the past week from 31 Oct 2016 - 5th Oct 2016, price of oil has actually been on a very strong downtrend. Prices closed at the end of the week breaking the 1st major support level @ 45.597. I do not know which directional bias price would take this week. But seeing how there are major news this week, it would probably be a "wait and see" kind of market. The US presidential election that happens on Tuesday, only takes place once every 4 years. It is honestly my first time as a trader going through such a news. Anyway, the following will be my analysis of how the week has ended.

Attached Image (click to enlarge)
Click to Enlarge

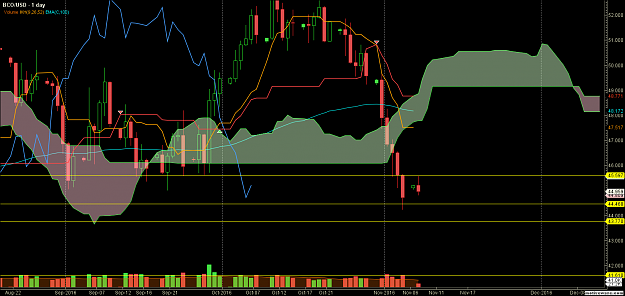
Name: BCOUSD - Primary Analysis - Nov-07 0001 AM (1 day).png
Size: 94 KB

Daily Chart:

  1. Cloud is bearish and is also downwards sloping. It seems that cloud is also starting to widen.
  2. Tenkan is now in the cloud.
  3. Kijun is still above the cloud.
  4. It is good to note that both Tenkan and Kijun are strongly downwards sloping.
  5. Chikou is below the cloud and will not meet any resistance any time soon.
  6. Price is clearly below the cloud and has broke past the immediate support line @ 45.597
  7. S1 @ 43.770 ; S2 @ 41.610 [Next major support based on price back in Aug 2016]
  8. R1 @ 45.597 [Support turned resistance] ; R2 @ 47.517 [Tenkan]
  9. Time frame outlook : Bearish -

Attached Image (click to enlarge)
Click to Enlarge

Name: BCOUSD - Primary Analysis - Nov-07 0006 AM (4 hour).png
Size: 96 KB

4HR Chart:

  1. Cloud is clearly bearish and wide. It also has a flat top @ 47.965
  2. Price, Tenkan + Kijun, Chikou are all below the cloud.
  3. Tenkan is below Kijun
  4. Kijun is very clearly, steeply sloped downwards
  5. Price while rebounding @ 44.509 level, it seems does not seem like buyers have enough strength to go against the strong downwards trend
  6. S1 @ 43.770
  7. R1 @ 45.343 [Tenkan] ; R2 @ 46.255 [Kijun]
  8. Time frame outlook : Bearish --

Attached Image (click to enlarge)
Click to Enlarge

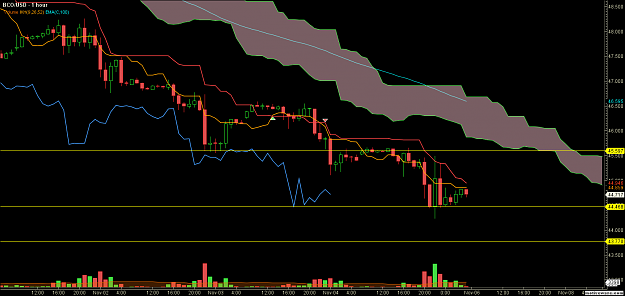
Name: BCOUSD - Primary Analysis - Nov-07 0015 AM (1 hour).png
Size: 73 KB

1HR Chart:

  1. Cloud is bearish and wide and is seen to be dipping downwards more.
  2. Price, Tenkan+Kijun, Chikou are all below the cloud.
  3. Tenkan is below Kijun. Tenkan is flat.
  4. Kijun is converging with Tenkan and is downwards sloping.
  5. Price has consistently closed below the Tenkan and Kijun. Good to note that however, on the last few hours of the last trading week, there seems to be an interim support level being formed @ 44.468
  6. S1 @ 44.468 [Due to sideways movement of price and alternating candlestick colour shows a fight between buyers and sellers] ; S2 @ 43.770
  7. R1 @ 44.946 [Kijun] ; R2 @ 45.290 [Chikou]
  8. Time frame outlook : Bearish --

Attached Image (click to enlarge)
Click to Enlarge

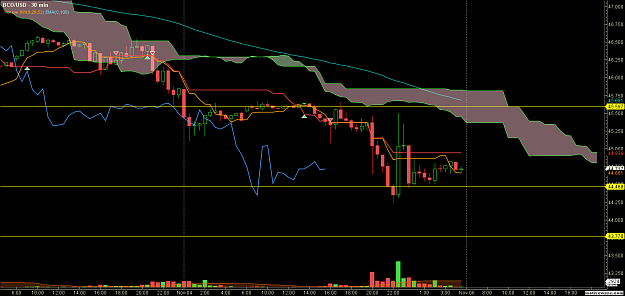
Name: BCOUSD - Primary Analysis - Nov-07 0014 AM (30 min).png
Size: 76 KB

30Min Chart:

  1. Cloud is bearish, however it has narrowed and seems to be moving sideways. Cloud has a flat top @ 44.946 and flat bottom @ 44.800
  2. Price, Tenkan+Kijun, Chikou are all below the cloud.
  3. Tenkan is below Kijun, however, it seems to be flattening
  4. Kijun has been flat for the past few 30 min session candles @ 44.939
  5. S1 @ 44.468
  6. R1 @ 44.800 [Cloud Flat Bottom] ; R2 @ 44.939 [Kijun] ; R3 @ 45.159
  7. Time frame outlook : Bearish -

Analysis : Given the uncertainty of the presidential election and EIA stocks crude change, price at the start of the week will probably trade in between the price range of (45.597 - 43.770). If trump is elected, being associated and viewed negatively, price might fall further. If hillary is elected, there might be a rebound that may take out the R1 price level. However, if oil is not at all affected by the presidential election, then we could very well start the week with a strong downwards move with fresh vigor.

Blessed trading week ahead all!


  • Post #14
  • Quote
  • Edited Nov 7, 2016 10:06am Nov 6, 2016 11:28am | Edited Nov 7, 2016 10:06am
  •  TalentTrader
  • | Joined May 2016 | Status: Member | 37 Posts
Here's my trade order for the starting of this week (7 Nov 2016):

  1. Shorted 2 units of BCO @ 44.658
  2. SL @ 44.946 - Based on 1HR Kijun
  3. TP @ 43.770 - Based on 4HR S1 level
  4. Risk Reward Ratio is 3:1

*Update*
No Trade was entered as you guys will see in my analysis later today that my Short entry price was not touched. However, I can take comfort in the fact that price is still range bound and moving within the interim support @ 44.468 (1HR) and resistance @ 45.597 on the 4HR timeframe


  • Post #15
  • Quote
  • Nov 7, 2016 10:39am Nov 7, 2016 10:39am
  •  TalentTrader
  • | Joined May 2016 | Status: Member | 37 Posts
Brent Crude (BCO/USD) - 7 Nov 2016

Attached Image (click to enlarge)
Click to Enlarge

Name: BCOUSD - Primary Analysis - Nov-07 2322 PM (1 day).png
Size: 94 KB

Daily Chart:

  1. Cloud is bearish. However, it has completely become flat with Top @ 48.771 and flat bottom @ 48.144
  2. Price, Tenkan and Chikou are all below the cloud.
  3. Kijun is currently in the cloud.
  4. Both Tenkan and Kijun are flat, with Tenkan below Kijun.
  5. Tenkan is flat @ 47.517 ; Kijun is flat @ 48.771
  6. Price opened this week with an upwards gap. But volume seems to be thin given that tomorrow is the USA Presidential election
  7. Price currently rebounded of R1 @ 45.597 and formed a downwards candle.
  8. S1 @ 44.468 ; S2 @ 43.770
  9. R1 @ 45.597 ; R2 47.517 [Tenkan]
  10. Time frame outlook : Bearish NA

Attached Image (click to enlarge)
Click to Enlarge

Name: BCOUSD - Primary Analysis - Nov-07 2326 PM (4 hour).png
Size: 69 KB

4HR Chart:

  1. Cloud is very bearish and has widened over the past few candlestick bars.
  2. Price, Tenkan + kijun, Chikou are all below the cloud.
  3. Tenkan is below Kijun. Tenkan also seems to be flat @ 44.946
  4. Kijun is flat @ 46.243.
  5. It is good to note that for today trading, price has consistently closed above the tenkan.
  6. S1 @ 44.835 [Based on this week opening candle gap] ; S2 @ 44.468 ; S3 @ 43.770
  7. R1 @ 45.597 ; R2 @ 46.243 [Kijun]
  8. Time frame outlook : Bearish -

Attached Image (click to enlarge)
Click to Enlarge

Name: BCOUSD - Primary Analysis - Nov-07 2330 PM (1 hour).png
Size: 67 KB

1HR Chart:

  1. Cloud is still generally bearish. However, it is good to note that cloud was rising for a bit before dipping back down. Cloud also has a flat top @ 45.386
  2. Price, Tenkan+Kijun, Chikou are all below the cloud.
  3. Tenkan has crossed over Kijun from below and is dipping back down again.
  4. Kijun is currently flat @ 44.939
  5. Price has closed below Tenkan but is still above Kijun. Price does seem to be breaking past Kijun though
  6. S1 @ 44.939 [Kijun] ; S2 @ 44.468
  7. R1 @ 45.263 [Tenkan] ; R2 @ 45.597 [Coincides with flat bottom of cloud]
  8. Time frame outlook: Bearish NA

Attached Image (click to enlarge)
Click to Enlarge

Name: BCOUSD - Primary Analysis - Nov-07 2334 PM (30 min).png
Size: 87 KB

30MIN Chart:

  1. Cloud is bullish however, it is good to note that cloud is now dipping downwards.
  2. Price, Tenkan+Kijun are above the cloud.
  3. Chikou is currently below cloud and seem to be running into resistance at previous Tenkan.
  4. Tenkan has crossed Below Kijun
  5. Both Tenkan and Kijun are downwards sloping.
  6. Price has consistently opend and closed below both tenkan and Kijun in the past few candlestick sessions.
  7. S1 @ 44.948 [Flat top of cloud before the twist] ; S2 @44.468
  8. R1 @ 45.142 [Tenkan] ; R2 @ 45.184 [Kijun]
  9. Time frame outlook : Neutral NA

Conclusion: While generally it seems that we are still bearish biased, my personal preference is to stay away and observe the market. Price seems to not be able to confidently break support on the 4HR chart (close below flat Tenkan); fail to close below the flat Kijun on the 1HR; fail to break through the cloud support on the 30Min.


  • Post #16
  • Quote
  • Nov 7, 2016 10:20pm Nov 7, 2016 10:20pm
  •  TalentTrader
  • | Joined May 2016 | Status: Member | 37 Posts
Ok. So while I said in my previous post that I would stay away, seeing the candlestick bar break out of the 30Min cloud, I immediately went into a short position. I shouldn't have.

I should have stuck to what I decided on and not let my feelings and emotion get the better of me. That was a losing trade. :X
 
1
  • Post #17
  • Quote
  • Nov 7, 2016 10:44pm Nov 7, 2016 10:44pm
  •  TalentTrader
  • | Joined May 2016 | Status: Member | 37 Posts
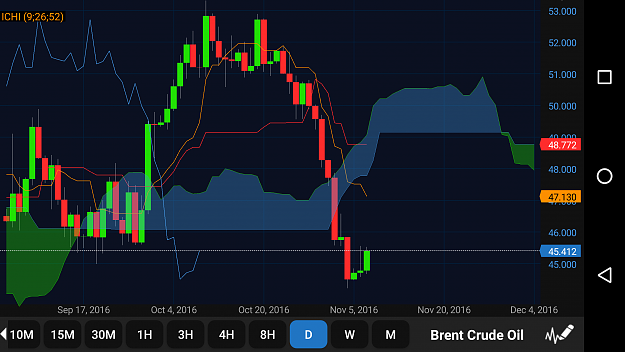
Brent Crude (BCO/USD) - 8 Nov 2016 @ 11am
Attached Image (click to enlarge)
Click to Enlarge

Name: Screenshot_20161108-112620.png
Size: 118 KB

Daily Chart:

  1. Cloud is bearish and dipping lower with a flat top @ 48.771
  2. Price, Tenkan and chikou are all below the cloud
  3. Kijun is flat @ 48.772 (A flat kijun will attract price)
  4. Tenkan is below kijun and is downwards sloping
  5. Price has closed below the tenkan. It is good to also note that price has retraced back from the support price @ 44.468
  6. S1 @ 44.468
  7. R1 @ 45.703 [Support turned reisistance] ; R2 @ 47.130 [Tenkan]
  8. Time frame outlook : Bearish NA

Attached Image (click to enlarge)
Click to Enlarge

Name: Screenshot_20161108-113250.png
Size: 122 KB

4HR Chart:

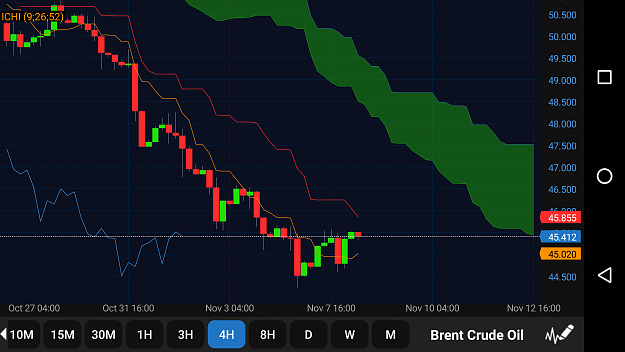
  1. Cloud is bearish and has also widened. Cloud has a flat top @ 47.520
  2. Price, Tenkan+Kijun, Chikou are all below the cloud
  3. Tenkan is below kijun. However, both tenkan and kijun seems to be converging
  4. Tenkan is upwards sloping, whereas kijun is downwards sloping
  5. Price is now above the tenkan
  6. It is good to note that current price level is also at the bottom of the cloud
  7. S1 @ 45.020 [Tenkan] ; S2 @ 44.500
  8. R1 @ 45.412 [Current price level] ; R2 @ 45.855 [Kijun]
  9. Time frame outlook : Bearish -

Attached Image (click to enlarge)
Click to Enlarge

Name: Screenshot_20161108-113933.png
Size: 112 KB

1HR Chart:

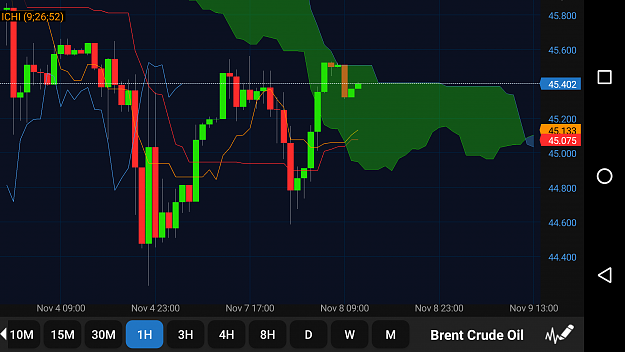
  1. The kumo cloud has twisted and is just abit bullish now.
  2. Price, Tenkan+kijun are in the cloud (This signifies that price is now neutral)
  3. Chikou is still below the cloud but may meet resistance in the price bars soon
  4. Tenkan is above Kijun. Tenkan is upwards sloping.
  5. Kijun just became flat @ 45.075
  6. It is good to note that price is also approaching the top of the cloud @ 45.512
  7. Price is at a very strong S/R zone as seen by the price levels forming around the Nov 4 period along with the recent peaks just before the Nov 7 period. Might want to lookout for a double top that is forming here
  8. S1 @ 45.262 ; S2 @ 45.133 [Tenkan]
  9. R1 @ 45.513 [Top of cloud] ; R2 @ 45.642 [Based on previous price peak]
  10. Time frame outlook : Neutral NA

Attached Image (click to enlarge)
Click to Enlarge

Name: Screenshot_20161108-114422.png
Size: 121 KB

30Min Chart:

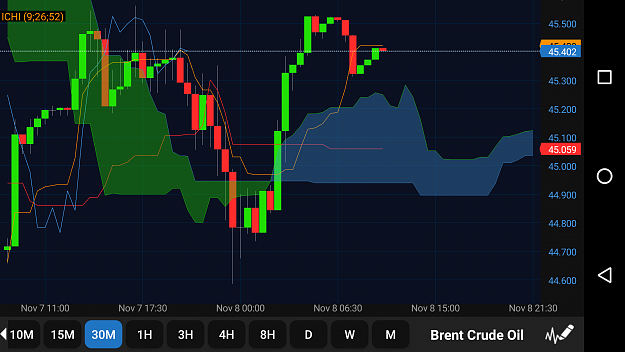
  1. Cloud is bullish but has become flat with a top @ 45.240 and a flat bottom @ 45.075
  2. Price, Tenkan and Chikou are all above the cloud.
  3. Kijun is within the cloud and is flat @ 45.059
  4. Tenkan is above the Kijun line however, tenkan is also flat @ 45.420
  5. Price has been closing just below the tenkan
  6. S1 @ 45.255 [Top of cloud] ; S2 @45.059 [Kijun]
  7. R1 @ 45.420 [Tenkan] ; R2 @ 45.525 [Recent Highs]
  8. Time frame outlook : Bullish NA

Â


  • Post #18
  • Quote
  • Nov 8, 2016 10:39am Nov 8, 2016 10:39am
  •  TalentTrader
  • | Joined May 2016 | Status: Member | 37 Posts
Brent Crude (BCO/USD) - 8 Nov 2016 @ 11pm

Attached Image (click to enlarge)
Click to Enlarge

Name: BCOUSD - Primary Analysis - Nov-08 2316 PM (1 day).png
Size: 98 KB

Daily Chart:

  1. Cloud is bearish, with a flat top @ 48.771. Cloud seems to be dipping slightly lower
  2. Price, Tenkan and Chikou are all below the cloud
  3. Kijun is flat @ 48.771
  4. Tenkan is below Kijun and has started to become more downward sloping
  5. Price is below tenkan and is currently sideways moving. Yesterday's candle was bullish touching the resistance @ 45.597. Today's candlestick has been bearish, pulling back from the same resistance level
  6. S1 @ 44.468 ; S2 @ 43.770
  7. R1 @ 45.597 ; R2 @ 47.368 [Tenkan]
  8. It is good to note that while in a sideways market, RSI is currently oversold.
  9. Time frame outlook : Bearish NA

Attached Image (click to enlarge)
Click to Enlarge

Name: BCOUSD - Primary Analysis - Nov-08 2322 PM (4 hour).png
Size: 76 KB

4HR Chart:

  1. Cloud is bearish but has become flat and sideways moving. Flat top of cloud @ 47.518, flat bottom of cloud @ 45.430
  2. Price, Tenkan+Kijun, Chikou are all below the cloud.
  3. Tenkan is below the kijun
  4. Both Tenkan and Kijun are flat. Tenkan flat @ 45.232 ; Kijun flat @ 45.628
  5. Price recently crossed above the kijun and has now formed below the tenkan
  6. S1 @ 44.468; S2 @ 43.770
  7. R1 @ 45.232 [Tenkan] ; R2 @ 45.628 [Kijun]
  8. Good to note that RSI has fallen below the 50 percent mark. That would mean that it is bearish yet there is still space for selling.
  9. Time frame outlook : Bearish -

Attached Image (click to enlarge)
Click to Enlarge

Name: BCOUSD - Primary Analysis - Nov-08 2332 PM (1 hour).png
Size: 82 KB

1HR Chart:

  1. Clooud is bullish, however there seems to be a dip in the cloud with a flat bottom @ 45.054
  2. Price and chikou are below the cloud.
  3. Tenkan and Kijun are in the cloud
  4. Tenkan is above the kijun. And it is good to note that Tenkan is downwards sloping.
  5. Kijun is flat @ 45.232
  6. Price action has been range bound since 4th Nov. And I believe that that was when the downwards trend has ended and now, price is just consolidating and moving sideways. Probably in anticipation of the US presidential election and also the EIA change of crude oil announcement
  7. S1 @ 44.781 [Gap at the start of this week on 7th Nov] ; S2 @ 44.468 ; S3 @ 43.770
  8. R1 @ 45.232 [Kijun] ; R2 @ 45.351 [Tenkan] ; R3 @ 45.400 [Top of cloud]
  9. It is good to note that RSI is now nearing the oversold region. The last time RSI came close to the oversold region, it retraced back towards the 50 percent level.
  10. Time frame outlook : Bearish NA

Attached Image (click to enlarge)
Click to Enlarge

Name: BCOUSD - Primary Analysis - Nov-08 2338 PM (30 min).png
Size: 101 KB

30MIN Chart:

  1. Cloud is slightly bullish, however there is a clear downwards dip in the cloud with a flat bottom @ 45.232
  2. Price, Tenkan and Chikou are in the cloud signifying neutrality and equilibrium
  3. Kijun however is above the cloud and is flat @ 45.351
  4. Tenkan is below kijun
  5. Price is hovering about the tenkan level
  6. S1 @ 45.074 [Flat bottom of cloud] ; S2 @ 44.756 [Previous low]
  7. R1 @ 45.232 [Flat top of cloud] ; R2 @ 45.351 [Kijun]
  8. It is good to note that RSI has just come out of the oversold region and is approaching the 50% level
  9. Time frame outlook : Neutral NA

Conclusion : Again, seeing how even though the general bias of my analysis is bearish, there is no clear indication. Markets are just consolidating, volume is thin, smart money is all waiting and watching. It would also then be wise to watch and not pick the scraps.


  • Post #19
  • Quote
  • Nov 14, 2016 11:32am Nov 14, 2016 11:32am
  •  TalentTrader
  • | Joined May 2016 | Status: Member | 37 Posts
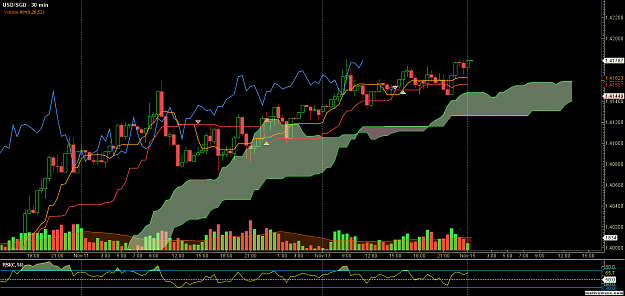
USD/SGD - 15 Nov 2016 @ 12am

So this is another instrument that I have been following closely ever since the US presidential election. I am neutral and like neither HRC or Trump. However, I strongly believe that even before Trump won, the market prices were already showing it. At about 10am Singapore time, the markets were all completely down. Even before it was confirmed that Trump won the presidential election. Anyway, as agreed, I stayed away from the markets mostly last week. It was until about Thurs and Friday (11th Nov 2016) that I entered a long trade for this pair. I still have a position open, but here is my analysis.

Attached Image (click to enlarge)
Click to Enlarge

Name: USDSGD - Primary Analysis - Nov-15 0014 AM (1 day).png
Size: 139 KB

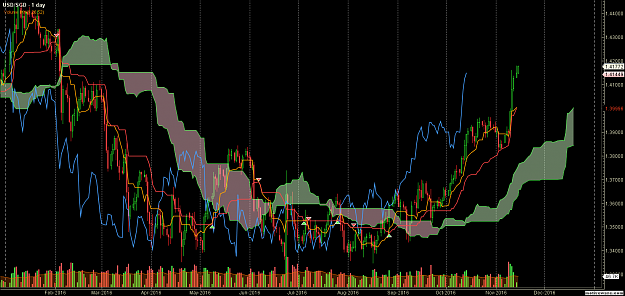
Daily Chart:

  1. Cloud is clearly bullish and is see to be moving upwards.
  2. Price, Tenkan + Kijun and Chikou are all above the cloud.
  3. Tenkan and Kijun are both upwards sloping.
  4. Tenkan is above the Kijun. However, Kijun seems to be converging really close to Tenkan and it seems as if Kijun might cross over tenkan from below.
  5. Price is above Tenkan and Kijun
  6. S1 @ 1.41302 (Daily gap) ; S2 @ 1.40044 (Tenkan)
  7. R1 @ 1.41850 (Based on flat bottom of cloud back in Feb to Mar 2016) ; R2 @ 1.42090 (Based on price support back in Jan 2016 to Feb 2016)
  8. Time frame outlook : Bullish ++

Attached Image (click to enlarge)
Click to Enlarge

Name: USDSGD - Primary Analysis - Nov-15 0020 AM (4 hour).png
Size: 85 KB

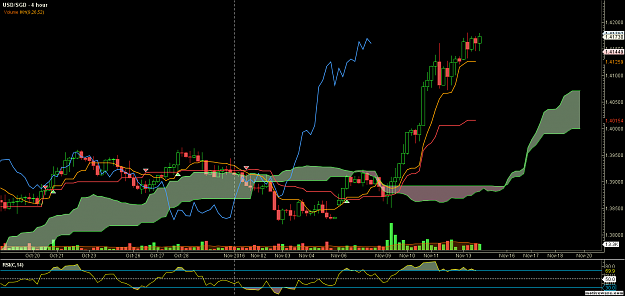
4HR Chart:

  1. Cloud is bullish. However there is a flat top @ 1.40707 and flat bottom @ 1.39996 forming
  2. Price, Tenkan + Kijun, Chikou are all above the cloud.
  3. Tenakn is above Kijun.
  4. Tenkan is flat @ 1.41259
  5. Kijun is flat @ 1.40154
  6. Price has been consistently closing above Tenkan
  7. S1 @ 1.41259 (Tenkan) ; S2 @ 1.40707 (Flat top of cloud) ; S3 @ 1.40154 (Kijun)
  8. R1 @ 1.42090 (Based on daily chart)
  9. It is good to know that because we are in an upwards trending market, Oscillator indicators (in this case, RSI) would not work well in a trending market. However, it is still good to note that RSI is downwards dipping and has just crossed below the overbought region.
  10. Time frame outlook : Bullish ++

Attached Image (click to enlarge)
Click to Enlarge

Name: USDSGD - Primary Analysis - Nov-15 0025 AM (1 hour).png
Size: 80 KB

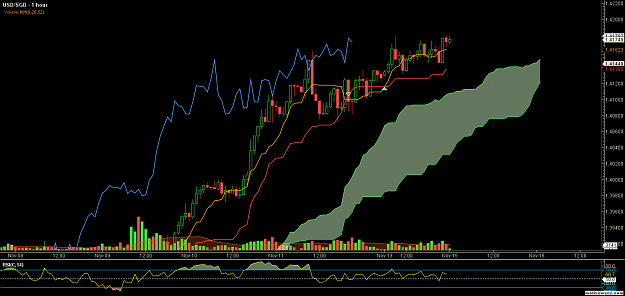
1HR Chart:

  1. Cloud is bullish. However, cloud is narrowing.
  2. Price, Tenkan + Kijun, Chikou are all above the cloud.
  3. Tenkan is above Kijun
  4. Both are upwards sloping. But kijun has a steeper upwards sloping gradient
  5. Price has also for the last two bars close above the tenkan
  6. Price is still on the upwards trend. However, it seems to be doing so on light volume.
  7. S1 @ 1.41623 (Tenkan) ; S2 @ 1.41380 (Kijun)
  8. R1 @ 1.41792 (Chikou Peak)
  9. Again, good to note that RSI does not show any overbought levels. In fact it is approaching the neutral region
  10. Time frame outlook : Bearish ++

Attached Image (click to enlarge)
Click to Enlarge

Name: USDSGD - Primary Analysis - Nov-15 0031 AM (30 min).png
Size: 88 KB

30MIN Chart:

  1. Cloud is bullish and upwards sloping. However, it seems to be narrowing - Similar to the 1HR tf.
  2. Price, Tenkan+Kijun, Chikou are all above the cloud.
  3. Tenakn is above Kijun.
  4. Both Tenkan and Kijun seems to be becoming flat. They are also moving parallel to each other
  5. Chikou just came out of price. However, when chikou is within price, it means that market is sideways moving
  6. The above seems to be confirmed with the fact that both Tenkan and Kijun are somewhat parallel.
  7. Price is above tenkan and kijun.
  8. S1 @ 1.41623 (Tenkan) ; S2 @ 1.41557 (Kijun) ; S3 @ 1.41488 (Cloud resistance)
  9. There is no nearby resistance.
  10. As price is in a sideways moving market, it means that on this 30 Min timeframe, price is not trending. It would therefore be good to refer to an oscillating indicator. Here, I used the RSI.
  11. RSI shows that price is nowhere near the overbought region. However, it is approaching 50% which means that price is actually in equilibrium.
  12. Time frame outlook : Bullish NA

Conclusion: As I am not extrememly concerned about the short time frame of 30MIN, however, it would be good to monitor RSI on this 30MIN time frame. For the reason that it would tell me if the sideways moving market is about to break into a start of a new upward/downward trend.

 
1
  • Post #20
  • Quote
  • Mar 12, 2017 12:31pm Mar 12, 2017 12:31pm
  •  TalentTrader
  • | Joined May 2016 | Status: Member | 37 Posts
So, I haven't been updating this journal for quite sometime now. I've been really swamped at work. Moreover, the past 10 trades that i've made, were all losers. I jumped in with a half-hearted mindset and I totally deserved the results I did. I should stop burning money this way if I am serious about making it work. Well, here I am with another update. So stick around, stay with me and watch me grow and get better.

Major news: Nothing much happening at the start of the week, except having major news release from the UK and USA over Wed (15th March) and Thurs (16th March).

Also, now, instead of just looking at candlesticks coupled with ichimoku, I will start using Heikin Aishi Trend Candles and also volume profile. Now i know that this means I essentially have 1 more indicator. But my reasoning is this. Ichimoku is mainly a trend system. I need a study / indicator that would show me how to trade when markets are ranging and moving sideways. Since my platform lacks market profile, I will turn to volume profile.

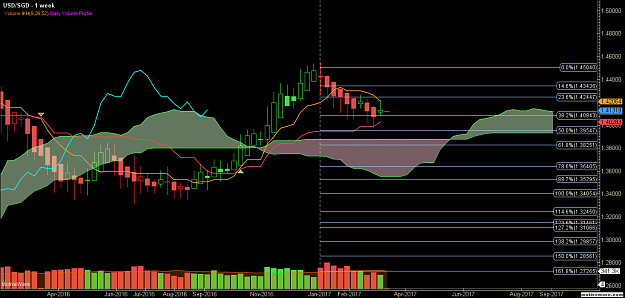
USD/SGD - 13th March 2017 (Weekly outlook)
Attached Image (click to enlarge)
Click to Enlarge

Name: USDSGD - Primary Analysis - Mar-13 0004 AM (1 week).png
Size: 73 KB


Weekly Chart:

  1. Prices have currently been in a strong downwards trend as noted via the heikin ashi candles
  2. Recent price high is at 1.5040
  3. Prices, tenkan, kijun and chikou are all above the cloud which shows general bullishness. Tenkan is also currently above the Kijun.
  4. However, prices are below tenkan and the tenkan seems to be a point of immediate resistance for price.
  5. Cloud is flat at about 1.38747
  6. Fibb Retracement has the next support level at 50% (1.39547), should the 38.2% support level be broken.
  7. Time frame outlook : Price will probably dip abit lower before meeting strong resistance at top of cloud. By then, if the cloud is still relatively thick, there is a high probability that price will trend upwards again.


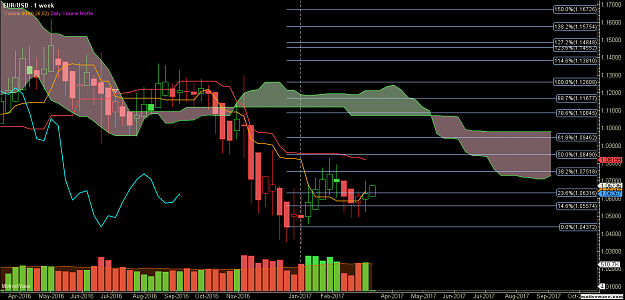
USD/SGD - 13th March 2017 (Weekly outlook)

Attached Image (click to enlarge)
Click to Enlarge

Name: EURUSD - Primary Analysis - Mar-13 0022 AM (1 week).png
Size: 77 KB


Weekly Chart:

  1. Prices have been ranging sideways since the start of the year.
  2. However Price, tenkan, kijun and chikou are all below the cloud which shows general bearishness. Tenkan is below the Kijun, but it is upwards sloping.
  3. Price has rebounded off the immediate support level of fibb retracement at 14.6% (1.05574)
  4. A strong resistance level would actually be about the 50% retracement level (1.08199) which is also the Kijun.
  5. Price is too far away from the cloud for it to actually move back towards the cloud unless there are some huge market moving news
  6. This week, with major news and meetings over wed and thurs, this might actually be possible.
  7. Time Frame Outlook : Watch for the major news release. Price has limited upside potential. Since price and chikou are clearly below the cloud, we are in very bearish territory.


  • Trading Journals
  • /
  • TT Ichimoku Cloud Trading Analysis with Trading Calls
  • Reply to Thread
    • Page 1 2
    • Page 1 2
0 traders viewing now
  • More
Top of Page
  • Facebook
  • Twitter
About MM
  • Mission
  • Products
  • User Guide
  • Blog
  • Contact
MM Products
  • Forums
  • Calendar
  • News
  • Market
MM Website
  • Homepage
  • Search
  • Members
  • Report a Bug
Follow MM
  • Facebook
  • Twitter

MM Sister Sites:

  • Energy EXCH
  • Crypto Craft
  • Forex Factory

Metals Mine™ is a brand of Fair Economy, Inc.

Terms of Service / ©2023