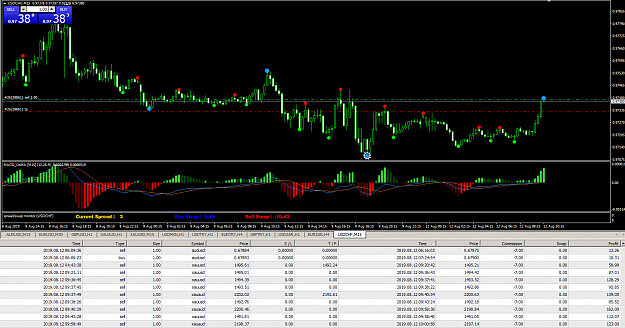
on stoploss , traders need to know where the market is doing and where its going starting from the day chart backwards give you a idea have a look at whats going on ,
gold
day chart tells me using macd and stoch telling me it could go down
4hr chart says it still down but nearing a up
1hr says sideways but looking like a up ,
30 min chart says sideways rangeing
its telling me short term buy but its also saying longer term it could be a sell that is my opinion i have been wrong before
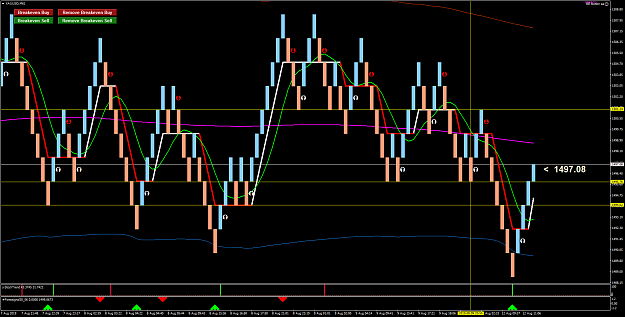
ITS ABOUT THE CASH NOTHING ELSE.
2