- Search Metals Mine
- 287 Results
-
 timingchain replied Apr 16, 2022
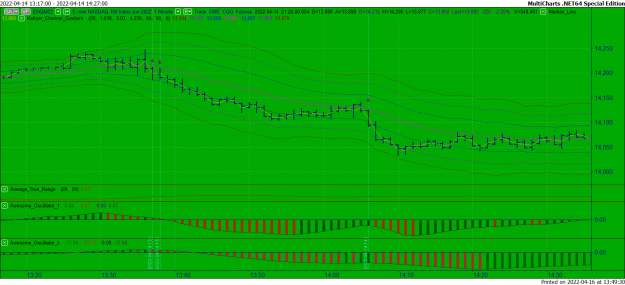
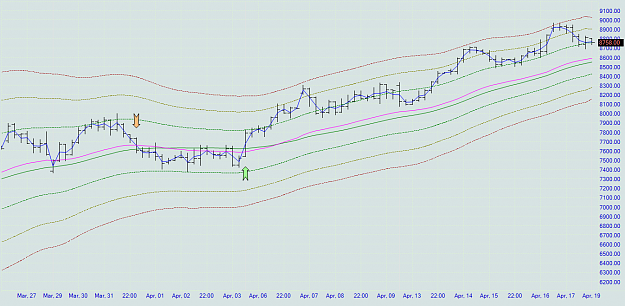
Good action from Thursday: 170 pt potential for NAS100 short.
Super Simple System for Scalping
- timingchain replied Apr 16, 2022
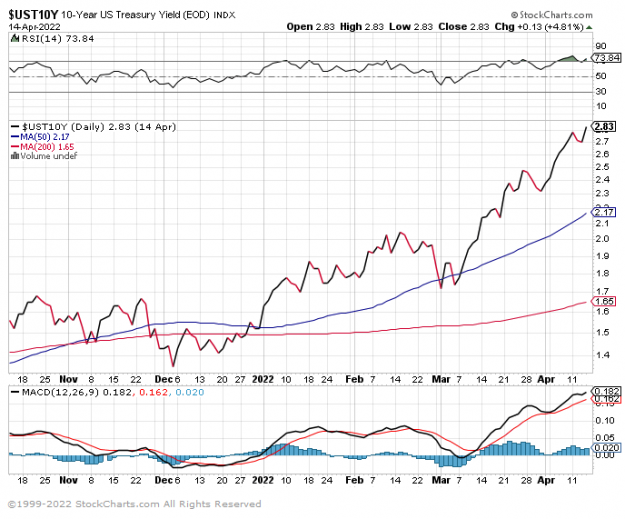
Scary chart of the week--treasury 10 yr yield. Stock market bias is down.
Super Simple System for Scalping
- timingchain replied Aug 8, 2020
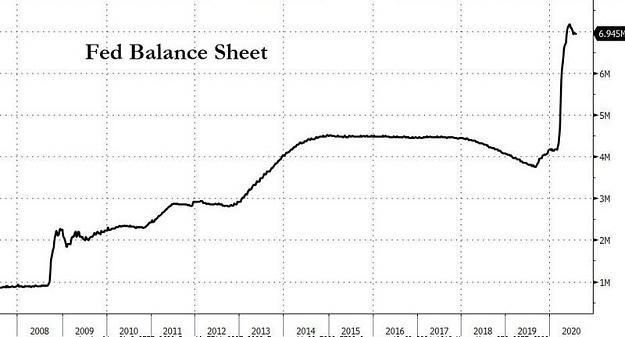
Things are looking up...and up and up! How long can energy and equities ignore this? Precious metals say not for long. image
WTI Crude Oil Trading
- timingchain replied Aug 1, 2020
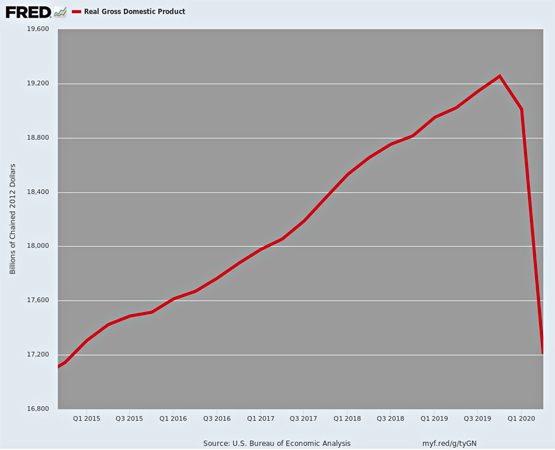
What has govt done to us with their lockdowns? 6 years of economic progress gone! It might not be long until stock and oil markets look like this GDP chart.
WTI Crude Oil Trading
- timingchain replied Jul 18, 2020
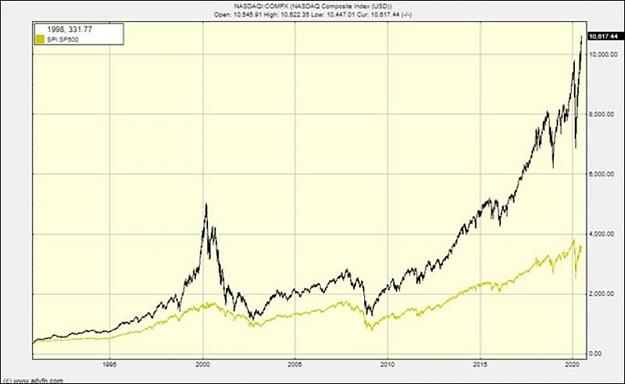
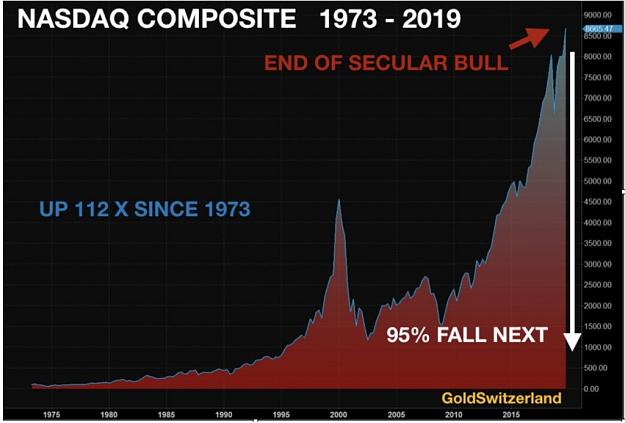
Nasdaq could collapse at any minute during the next 6 months
WTI Crude Oil Trading Nasdaq collapse should be very negative for oil. Nasdaq Composite & SP500 for 1990 - 2020: image
- timingchain replied Apr 19, 2020
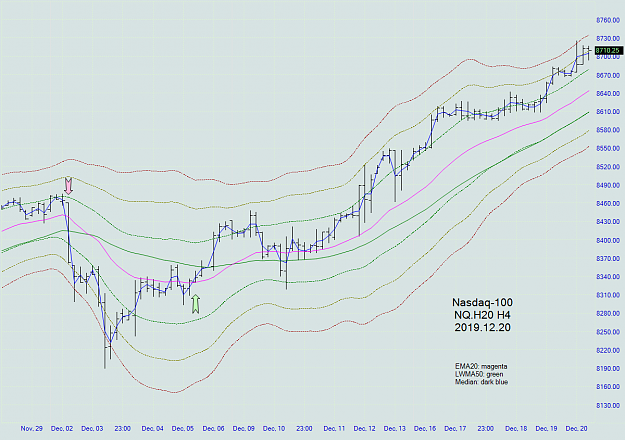
NQ e-mini June contract H4 I use H4 for trend indication, while I trade M15 & M5 The centerline is EMA20 (magenta)
NAS100 NASDAQ100 Only (ND and NQ Futures and CFDs)
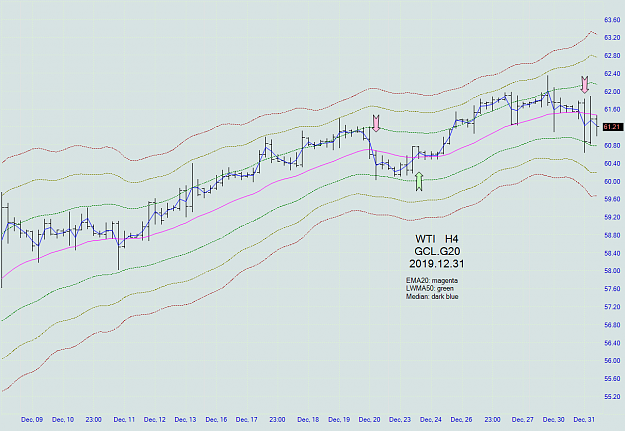
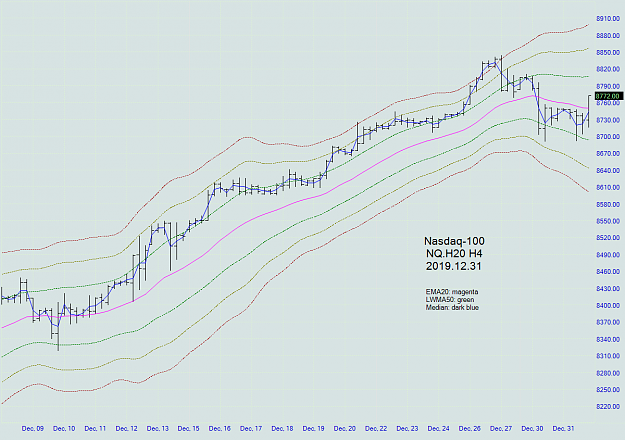
- timingchain replied Dec 31, 2019
The last trading day of the year was mostly churning, but little net movement until a final surge in equities. There is a bearish smell to it. Big Bear might soon come out of hibernation. Market pressure on bond prices could lead to higher interest ...
WTI Crude Oil Trading
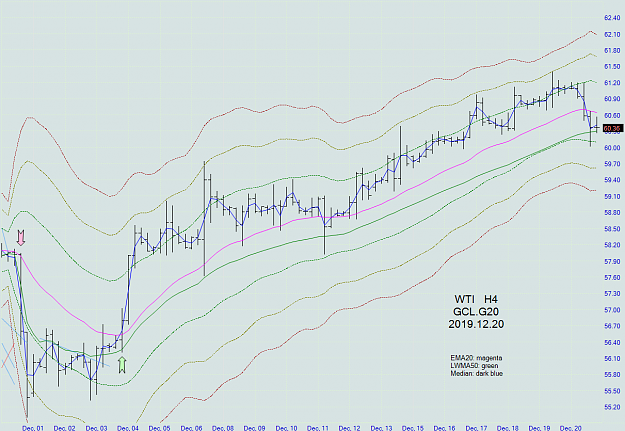
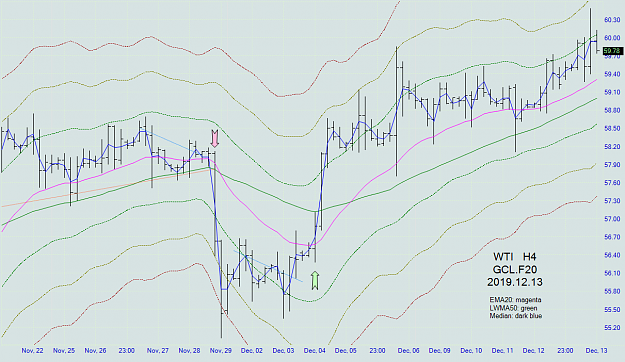
- timingchain replied Dec 20, 2019
WTI H4 Jan Contract End of Week, Dec 20 The H4 chart shows a strong run continuing from a low on Dec 3. Quite coincidently, I'm sure, the NQ (NASDAQ-100), YM (DJIA), and ES (SP500) contracts also took off on Dec 3 and are still running. The Green ...
WTI Crude Oil Trading
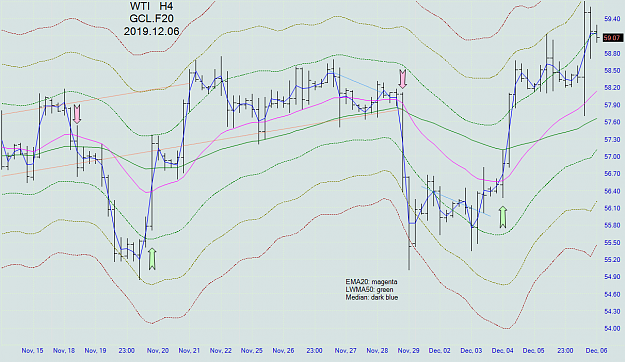
- timingchain replied Dec 13, 2019
WTI H4 Jan contract end of week Since the Green Arrow appeared on Dec 4, WTI has advanced ~300 pips, reaching the 60 level, but not closing above. The EMA20 line supported the advance. Perhaps 60 will be breached next week. As long as the equities ...
WTI Crude Oil Trading
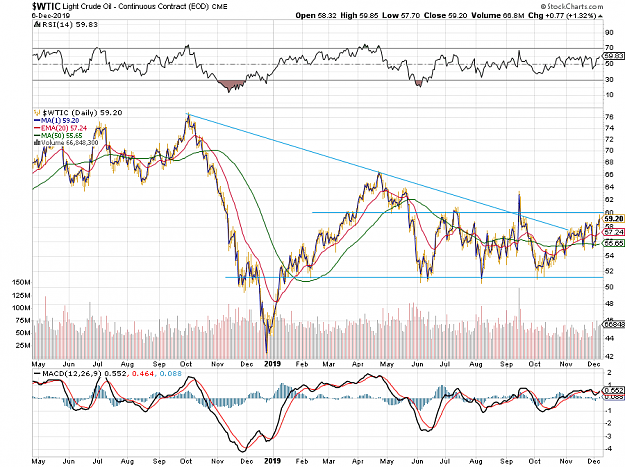
- timingchain replied Dec 8, 2019
WTI H4 Jan contract end of week image WTI daily image
WTI Crude Oil Trading
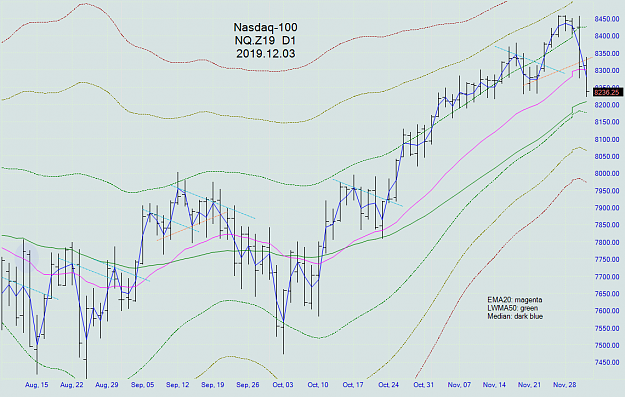
- timingchain replied Dec 3, 2019
NQ Dec contract There is plenty of room for a down move this month. Upturn later in Dec?
Private Island Traders
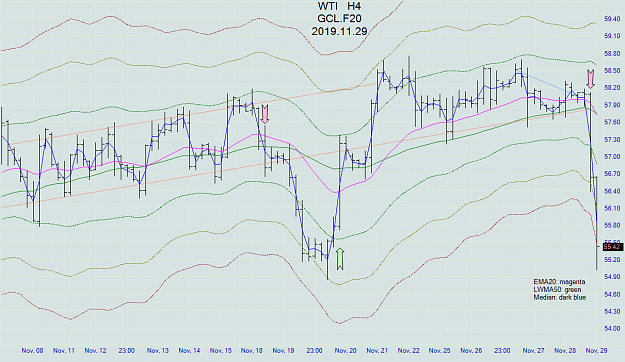
- timingchain replied Nov 29, 2019
A new Red Arrow followed by a plunge of ~300 pips on heaviest volume in Nov. Jan contract.
WTI Crude Oil Trading
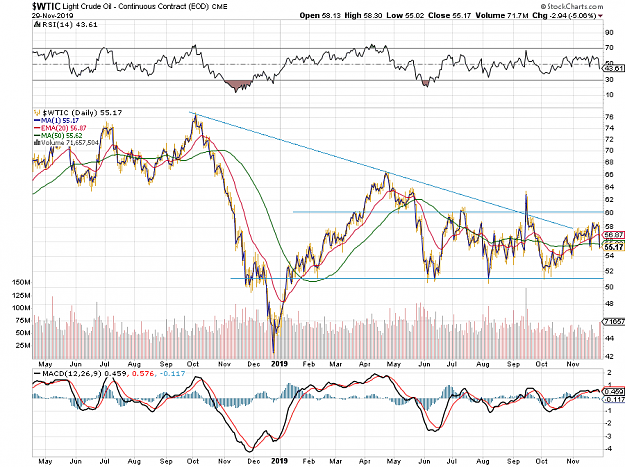
- timingchain replied Nov 23, 2019
WTI D1 Possible strong resistance ~60, which might be the top of range band, for a while anyway. The wedge from Oct is broken.
WTI Crude Oil Trading
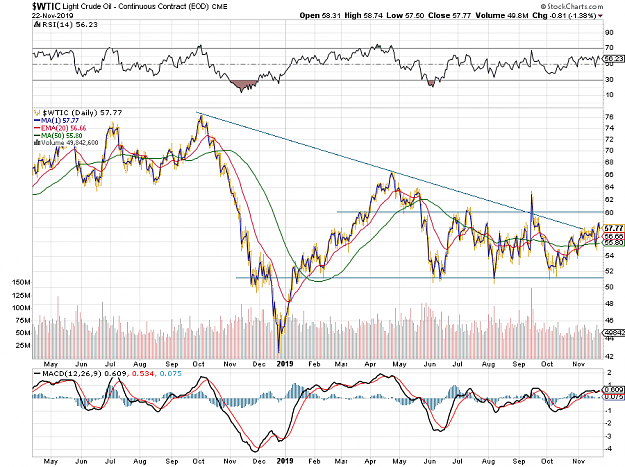
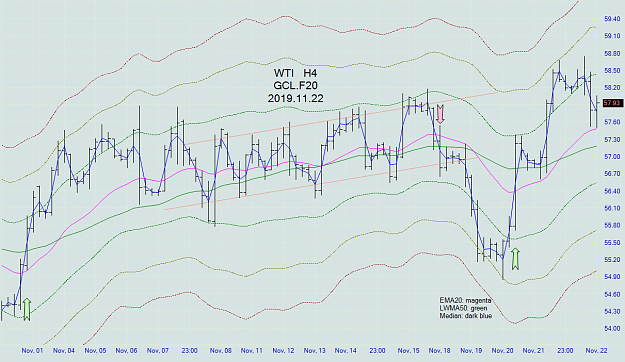
- timingchain replied Nov 22, 2019
WTI Jan contract end of week. Everyone had an opportunity to be wrong this week.
WTI Crude Oil Trading
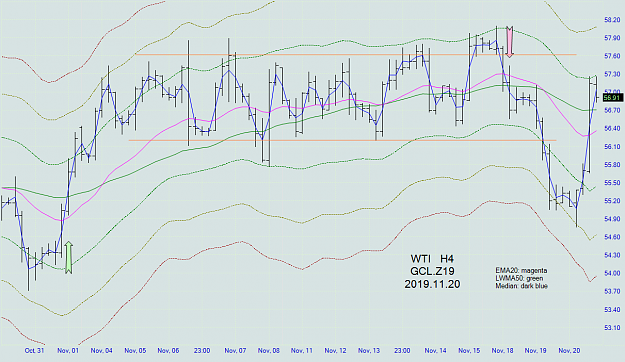
- timingchain replied Nov 20, 2019
The bull run seems overly large for the storage number the same as expected.
WTI Crude Oil Trading
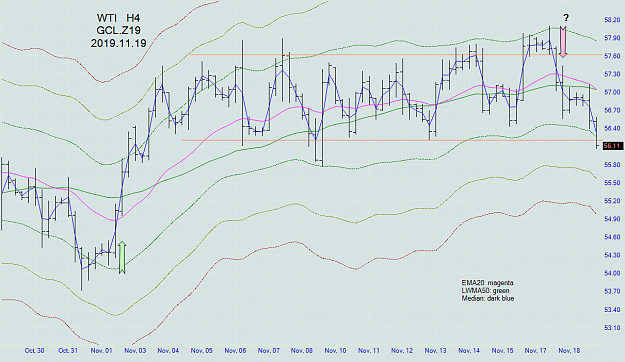
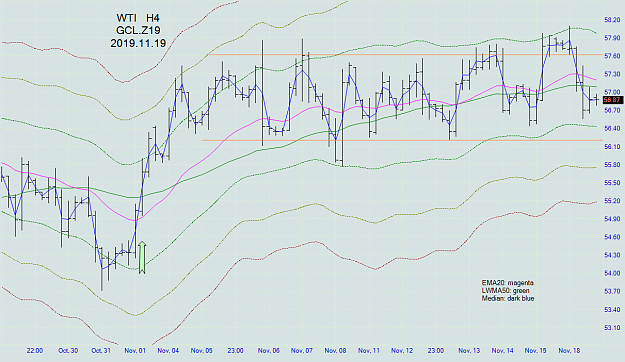
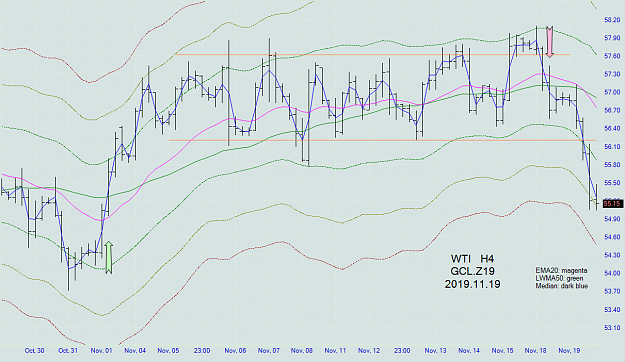
- timingchain replied Nov 19, 2019
Red Arrow, breached trading range, and sitting at a support zone. Trading resumption could be very interesting.
WTI Crude Oil Trading
- timingchain replied Nov 19, 2019
Russia Unlikely To Agree To Deepen Oil Output Cuts At Talks Next Month
WTI Crude Oil Trading