- Search Metals Mine
- 187 Results (6 Threads , 181 Replies )
-
 mladen replied Feb 5, 2024
In TA some functions are, sometimes, overestimated and some are sometimes, underestimated One of the usually underestimated is the the function used for calculating minimum or maximum of some data sample almost all functions that I saw that do that ...
Experiments - while waiting for an order to get closed
- mladen replied Feb 3, 2024
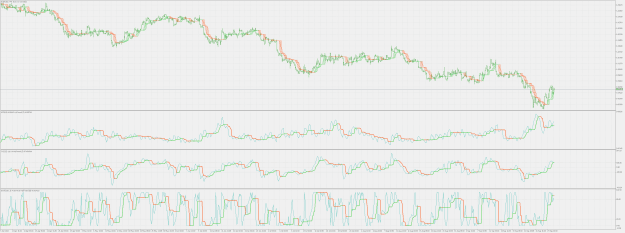
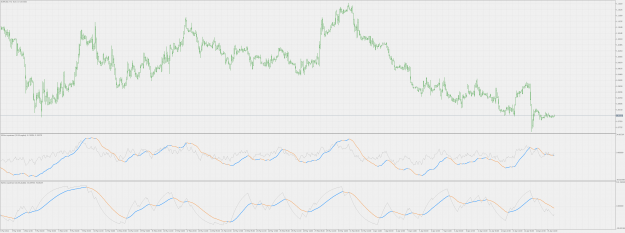
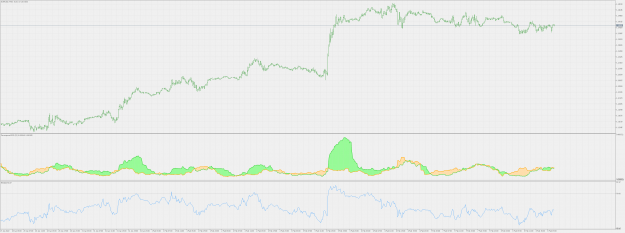
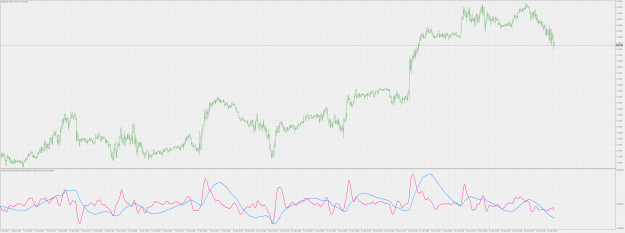
Adding some color to otherwise grim world all the usual rsi types floating around in one single indicator all the usual prices (some he prices tend to produce interesting rsi results) and some fooling with coloring methods image
Experiments - while waiting for an order to get closed
- mladen replied Jan 12, 2023
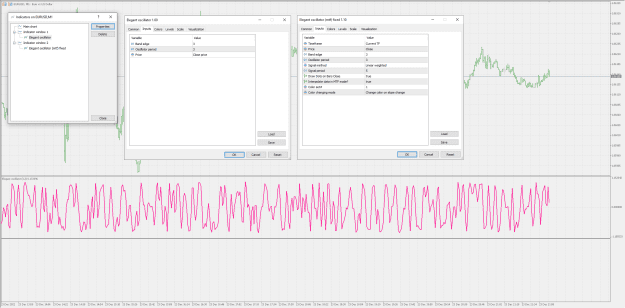
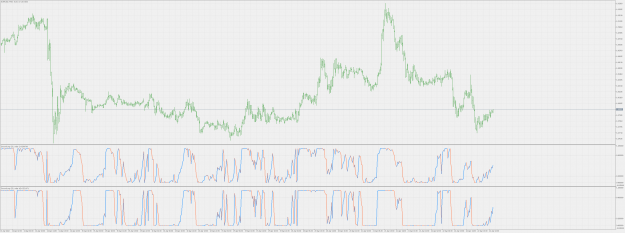
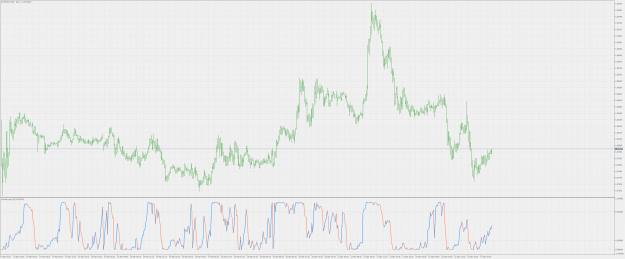
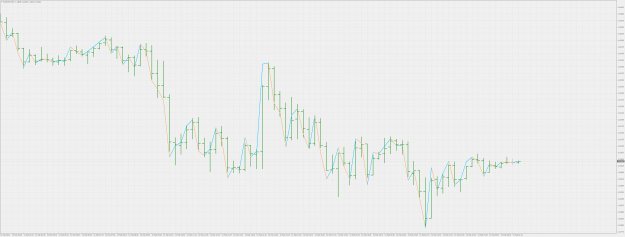
Experimenting ... Simple idea : two most common stochastic indicators used in a par. Seems to be usable image Some experimenting with parameters advised prior to using it in trading
Experiments - while waiting for an order to get closed
- mladen replied Dec 24, 2022
Hi durak image All the best durak Good bye durak
TMA+CG Mladen indicator problem - rewrite the indicator, please
- mladen replied Nov 2, 2022
Hi durak
TMA+CG Mladen indicator problem - rewrite the indicator, please Since asking you to read the ranting you posted again so that you understand what exactly you (as in "all we need is",
  I was unaware that I am talking to a royalty, but ...
- mladen replied Oct 7, 2022
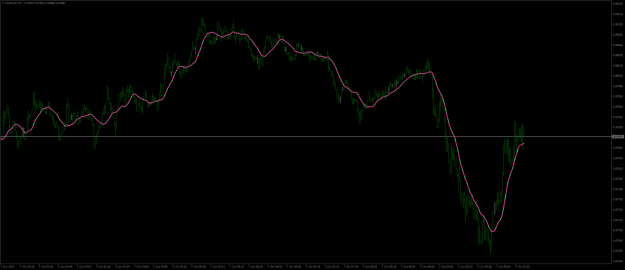
Listen you pathetic durak : Here is a very simple example : image So : it changes color on each new bar What I expect from you is to make that exact same thing using 2 drawing buffers instead of 3 (since you are blabbing that it can be done) and ...
TMA+CG Mladen indicator problem - rewrite the indicator, please
- mladen replied Oct 5, 2022
One more experiment ___________________________ Seems that lately there is a hype of indicators with on / off buttons This one will be one of those too, but : a lot of versions I have seen with on/off buttons are simply not OK they are making the ...
Experiments - while waiting for an order to get closed
- mladen replied Oct 2, 2022
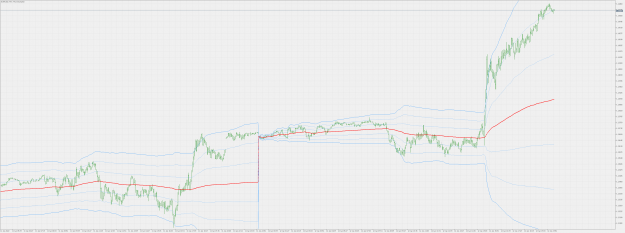
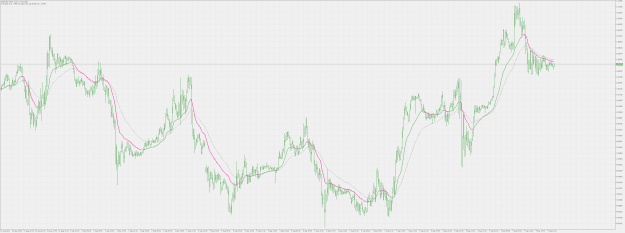
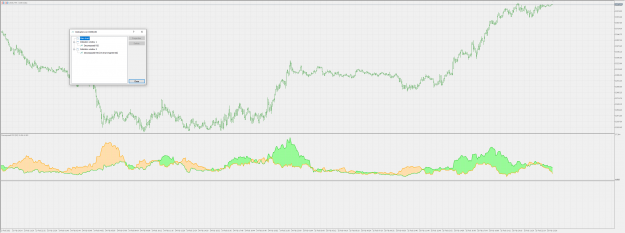
One more experiment : half trend that can be applied to price(s) or any other indicator - the possibility for custom indicators that exists for metatrader 5. That possibility (unfortunately) is not possible for metatrader 4 custom indicators. On the ...
Experiments - while waiting for an order to get closed
- mladen replied Sep 10, 2022
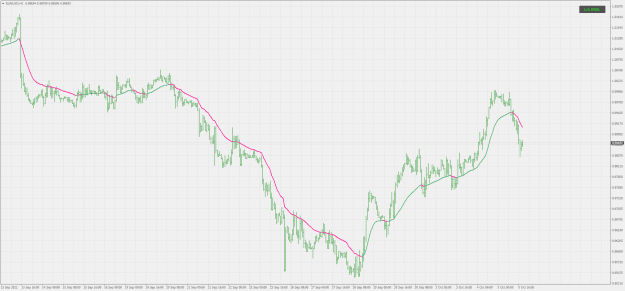
Indicator based on TASC August 2022 issue by Vitraly Apirine : "The Linear Regression-Adjusted Exponential Moving Average" image Gray line is the "regular" ema, added to example as a comparison to the "Linear Regression-Adjusted Exponential Moving ...
Experiments - while waiting for an order to get closed
- mladen replied Aug 25, 2022
Use the newest version (from this post Yet another news reader... | Page 9 | Forex Factory ) It works as expected : image
Yet another news reader...
- mladen replied Apr 24, 2022
Generalized version (which allows different orders of calculation) of the above indicator. The higher the order (max 16) the smoother it should be (but do not confuse it with average type of smoothing, this indicator has nothing in common with those ...
Experiments - while waiting for an order to get closed
- mladen replied Apr 24, 2022
Smooth step indicator (a way to normalize values into predictable ranges). It is a sigmoidal function that, in the way it is calculated, belongs to min/max normalization methods (usually called stochastic oscillator when it comes to metatrader). ...
Experiments - while waiting for an order to get closed
- mladen replied Apr 17, 2022
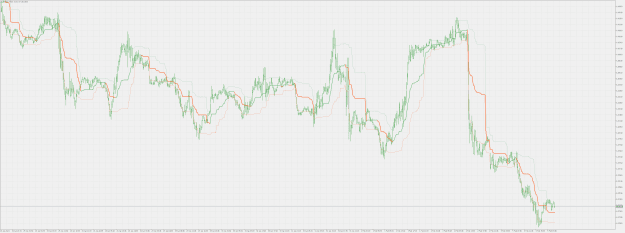
One more experiment ... ADXm that can use itself (ie: ADXm od ADXm) to filter out some false (color change) signals) that can happen when the original calculation is used. The lag is almost non existing and the results seem to be usable image PS: ...
Experiments - while waiting for an order to get closed
- mladen replied Feb 26, 2022
In the spirit of "cooperation" here is a function (that you could have copied from numerous already posted codes) that is returning the price : double iGetPrice(ENUM_APPLIED_PRICE price, double open, double high, double low, double close) { switch ...
Decomposed RSI [reverse engineered]
- mladen replied Feb 14, 2022
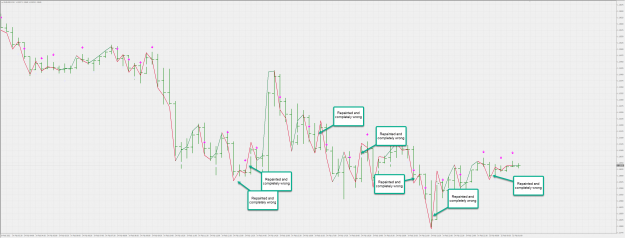
I hope you don't mind using your post as a starting point for this post It is not directly connected, but in the end it implicitly is ----------------------------------------------- It has been told multiple times that repainting is a coding error ...
TMA+CG Mladen indicator problem - rewrite the indicator, please
- mladen replied Feb 12, 2022
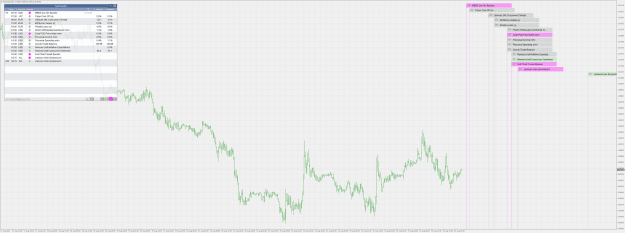
I shall repeat once again and that concerns the first message of this thread : I have no intention to "fix" anything that resident pundits of any forum, changed in any possible way. Not my problem ... Here is a test EA coded by me that uses the ...
TMA+CG Mladen indicator problem - rewrite the indicator, please
- mladen replied Feb 8, 2022
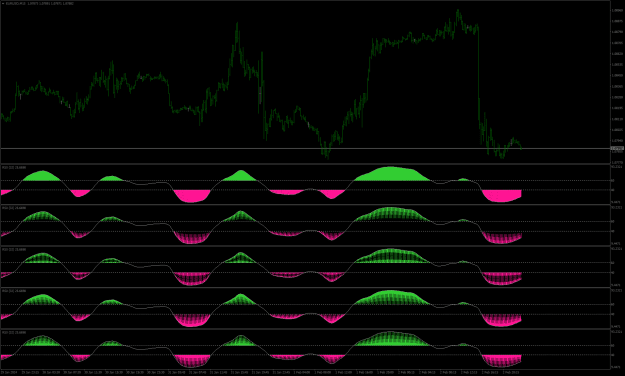
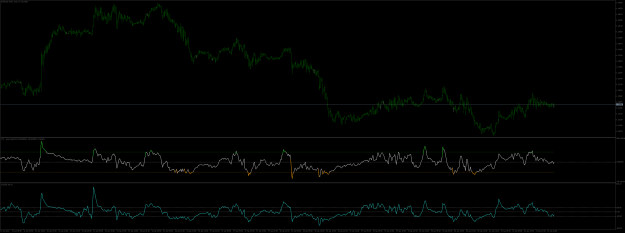
As the name of the thread suggests : one more experiment RSI in different form : decomposed form. It might be a bit easier to follow the possible RSI signals this way - see the example and how this indicator compares to RSI (and it is RSI
Experiments - while waiting for an order to get closed) ...
- mladen replied Jan 22, 2022
That is not ema based cci The values of the 2 can not be the same as on your example, they have to have different values : image So, even though they are similar (but just similar), they are not and can not be the same
Experiments - while waiting for an order to get closed
- mladen replied Jan 14, 2022
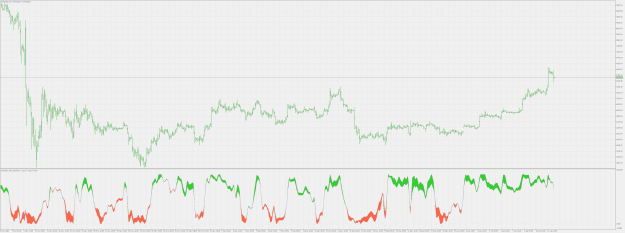
In his article in February 2022 issue of TASC, “An Elegant Oscillator: Inverse Fisher Transform Redux,” author John Ehlers explains how he uses the inverse Fisher transform to create an indicator he calls the elegant oscillator. This is the ...
Experiments - while waiting for an order to get closed
- mladen replied Jan 12, 2022
Just one more example to the upper case (removed the zones colors in order to make it clearer to see the actual levels) This is what the sliding deviation calculation is doing to the whole thing, and it does, at least that is my opinion, quite a ...
Experiments - while waiting for an order to get closed