- Search Metals Mine
- 161 Results
-
 limprobable replied Nov 14, 2023
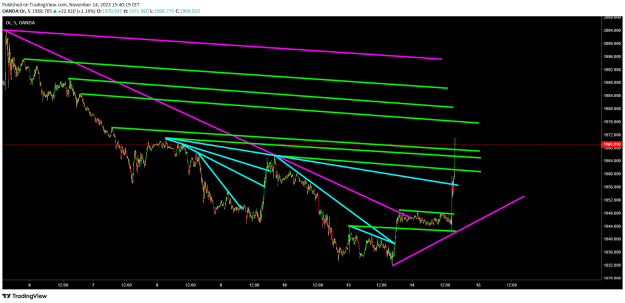
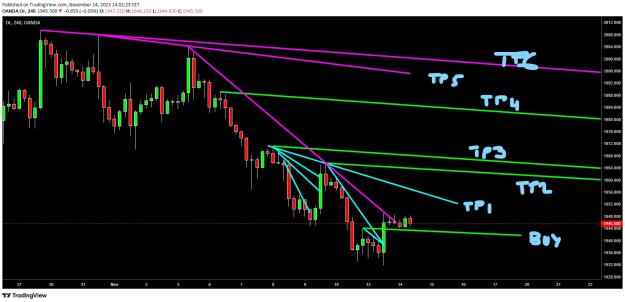
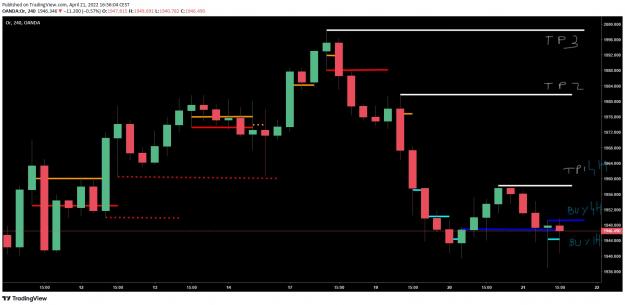
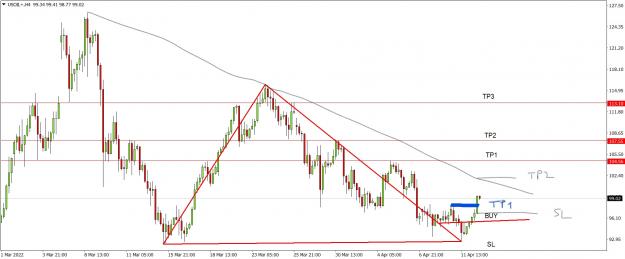
Thanks for your feedback. Yes, not really easy when you trace by hand. I can never do it on my smartphone. Difficult to know sometimes where to take profit (I took mine at the first TP, burned by the previous trade), just one last image to show TP 3 ...
SHTP - Simple Hidden Trading Patterns
- limprobable replied Nov 14, 2023
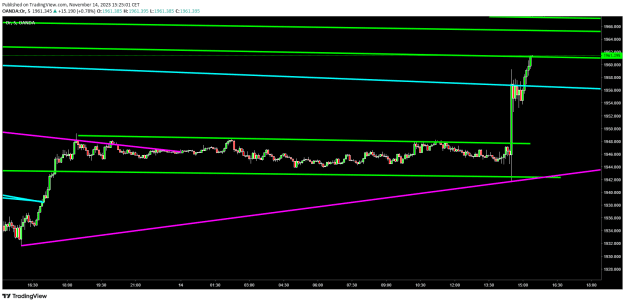
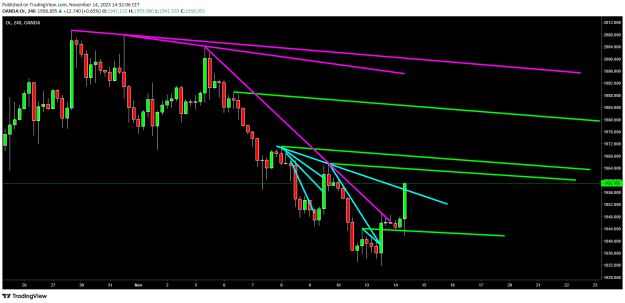
after 30 minutes of light resistance, TP 2 was reached image
SHTP - Simple Hidden Trading Patterns
- limprobable replied Nov 14, 2023
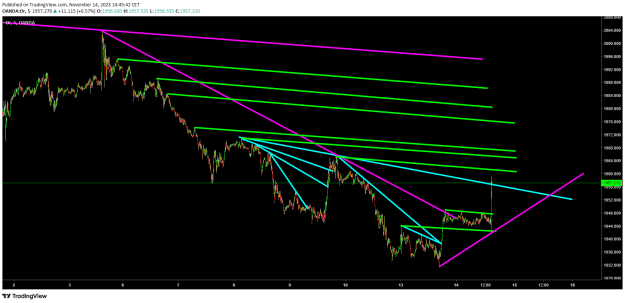
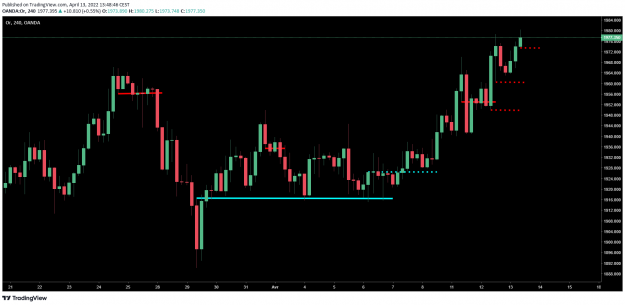
Just in 2 minutes after the news = TP 1 image
SHTP - Simple Hidden Trading Patterns
- limprobable replied Nov 14, 2023
Hello, Very interesting.Thank you for sharing I want to learn more about your trading. image Un commentaire?
SHTP - Simple Hidden Trading Patterns
- limprobable replied Jun 8, 2023
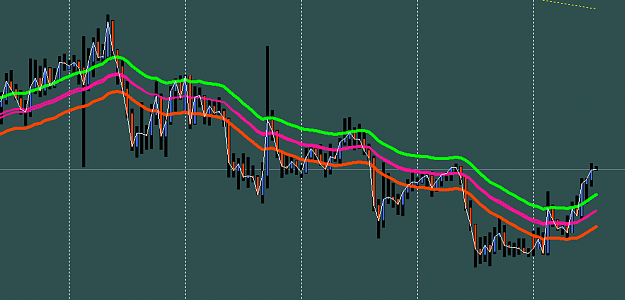
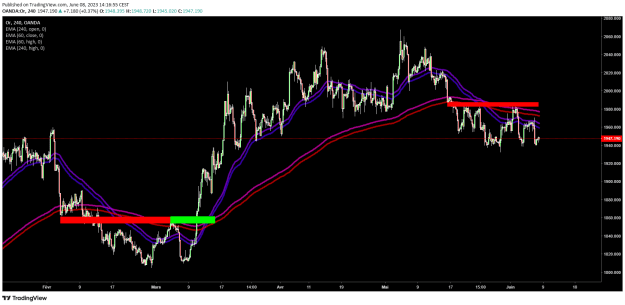
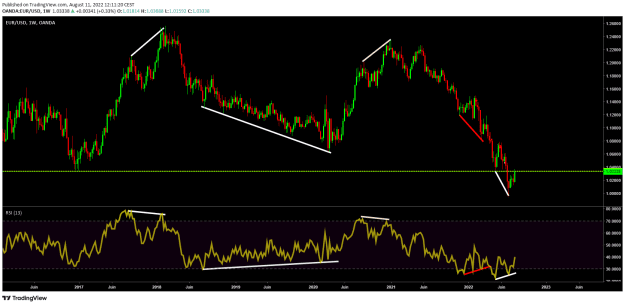
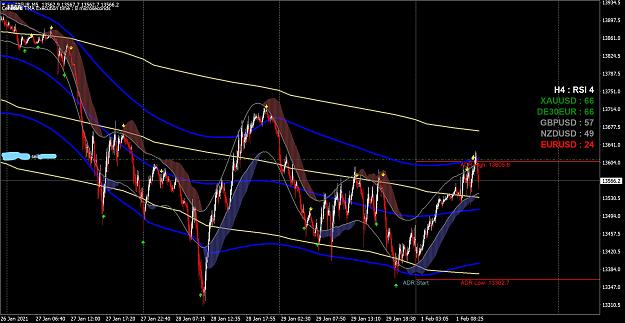
Good thread, I use EMA 240 and only close/high to determine levels (or EMA 240 HA on MT4). But same trading. Note that EMA 240 4 H = EMA 60 12H if you play with the TFs and EMAs you can build the structure of the markets image green pips
ISR Method
- limprobable replied May 11, 2022
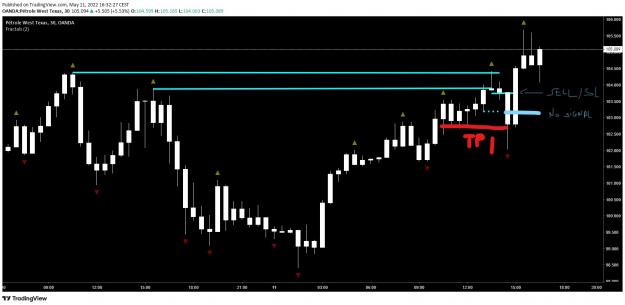
you can grab some pips or at least have your SL on 0 image
V Pattern (Enjoy Your Sell)
- limprobable replied Apr 27, 2022
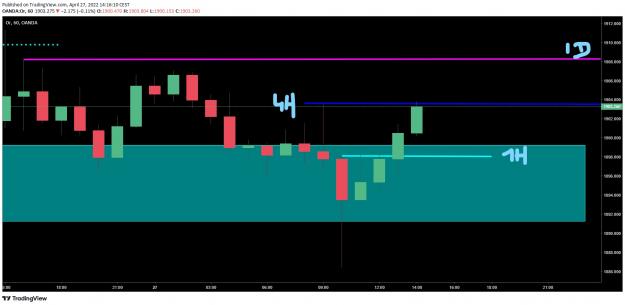
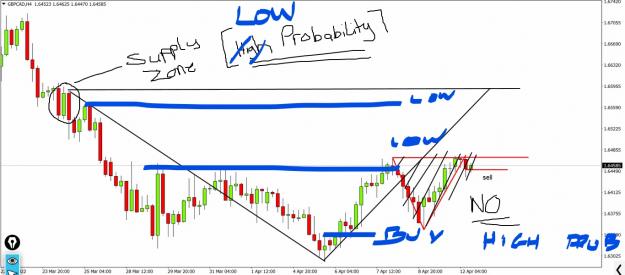
image V pattern 1H TP 1 hit. Waiting for a V pattern on H4 and D1? or take profit?
V Pattern (Enjoy Your Sell)
- limprobable replied Apr 12, 2022
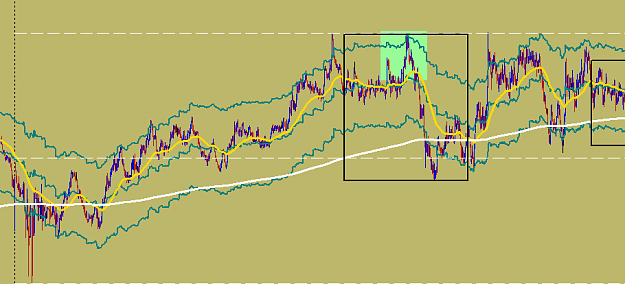
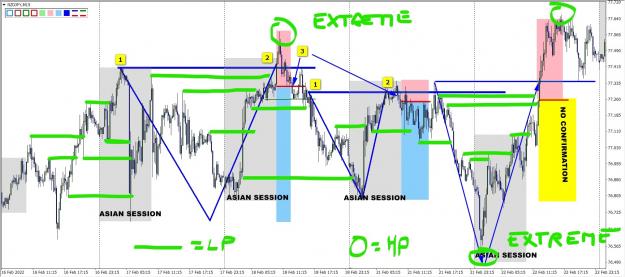
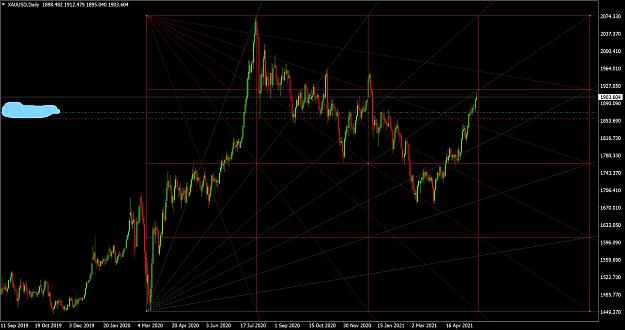
image green lign = LP = low probability or little profit green circle = Extreme = Higher probability and bigger profit fractal structure of markets take it or leave it
V Pattern (Enjoy Your Sell)
- limprobable replied May 26, 2021
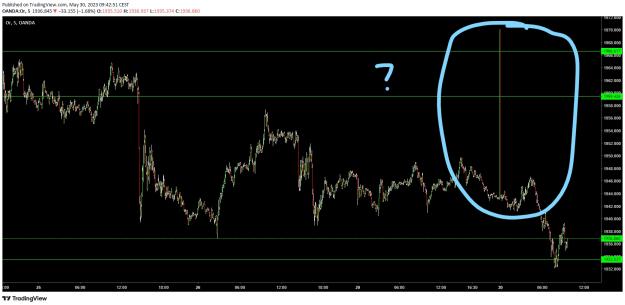
Hello Swede, Does it makes sense to sell now? image green pips Edit: after little adjustement, not yet but probably soon?
Time and Price Forecasting
- limprobable replied Jan 25, 2021
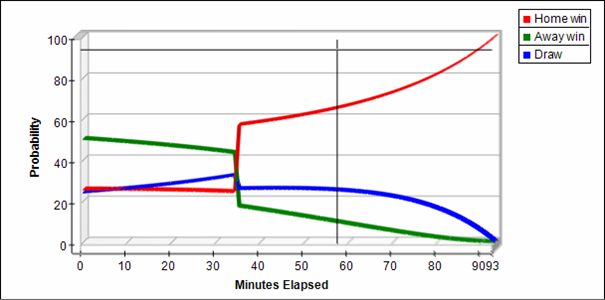
image They are so many ways to interpret that, that it's impossible to give you an answer. . The only interpretation without more info, is if i take the red line, and if i consider a buy trade, if i consider only one TF, at the begining of the ...
Price action at the core = family members' discussion project
- limprobable replied Dec 19, 2020
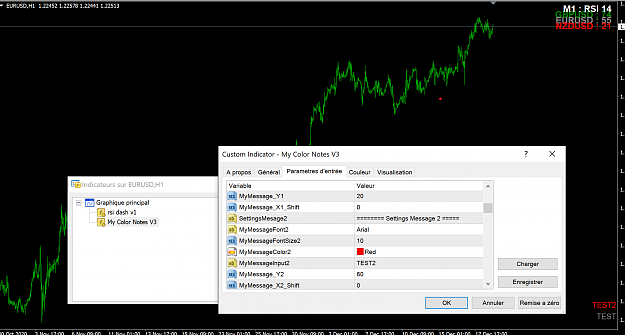
Hello, thanks for this thread and the rsi dash. is it possible to add function to adjust verticaly distance like in this mynote indicator please? image
RSI Dash
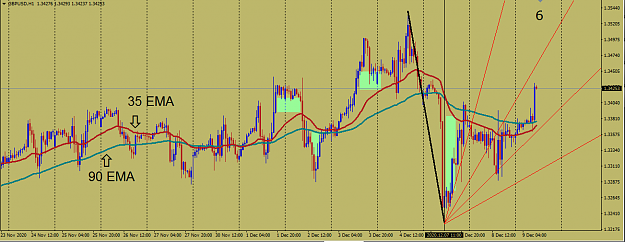
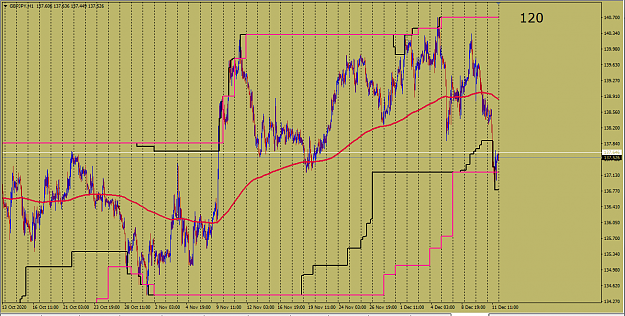
- limprobable replied Dec 13, 2020
image image image image image image ETC... YOU are making things complex and confusing. You say some things without really saying... only few traders can be in your mind to see what you want to show. most of them are lost. do you get an idea ...
Price action at the core = family members' discussion project