- Search Metals Mine
- 10 Results
- aman4forex replied Jul 24, 2017
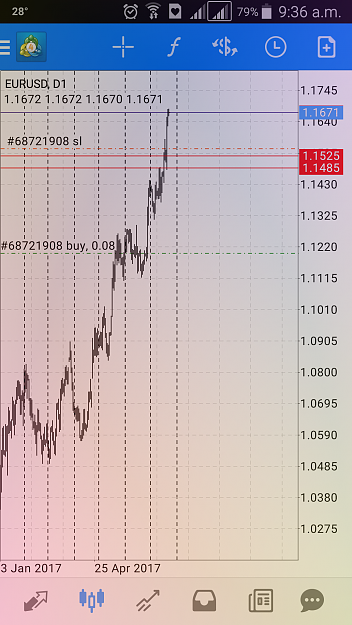
Time is a key the way areas are created and way it is tested look for euro chart higher time to mark the S/R decisions and test it rather was a fakeout that did the job below previous low from 1.1378 area. Same reaction on kiwi chart Although it is ...
ReadtheMarket - Supply and Demand with Price Action
- aman4forex replied Aug 5, 2015
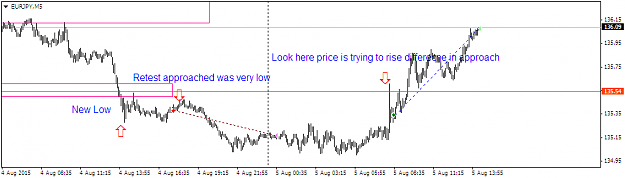
Two different scenarios two Different trades second one went with the momentum and that what we need to know when to cover and when to exit. Take a look at the chart. image
Trade Imbalance with Updates
- aman4forex replied Aug 3, 2015
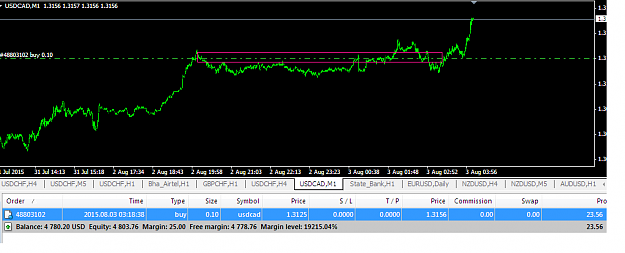
Trade Close +50 I am out Today. Will post If find anything interested. image
Trade Imbalance with Updates
- aman4forex replied Aug 3, 2015
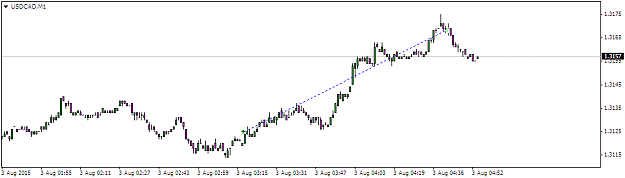
We can never deny the fact that price is fractal and when swing are quite clear on higher and intraday time frames then its better to stay and react when something happen quickly at LTF . Reason for my long on m1 is clear example of synchronization ...
Trade Imbalance with Updates
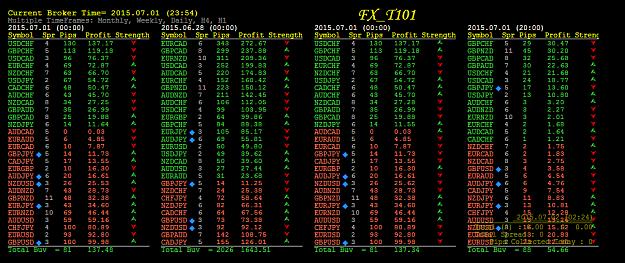
- aman4forex replied Jul 1, 2015
Ya, It works. I changed the broker now . It works fine Check it image Now what's next . There are blue dots in front of c5 pairs. How to see strength and open trades in direction of trend.
The seemingly impossible: $25-$500
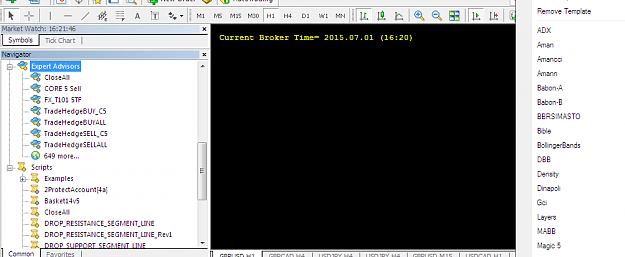
- aman4forex replied Jul 1, 2015
Ya dear I did exactly as phemmy said but still there is blank screen. I hope receive some more advice from him. If I have done exactly as recommended. rgds Aman Phem I did exactly as you mentioned EA's are in experts folder and scripts as well as ...
The seemingly impossible: $25-$500
- aman4forex replied Jul 10, 2012
Thanks for the aussie update — thats perfect thinking I am staying out aussie looking for aussie to break below 1.0125 or 1.0220 then there is possibility the picture is not clear.................though kiwi has one possibility h1 chart would ...
Elliott wave outlook
- aman4forex replied Jul 8, 2012
Thanks for the humble reply — Ya thanks for the reply the recent daily chart of crude oil clears the picture whether wave 4 has completed or we are still in wave 4 But beleive me I think its not over yet........ .We are still in wave 4 and the ...
Elliott wave outlook
- aman4forex replied Mar 21, 2011
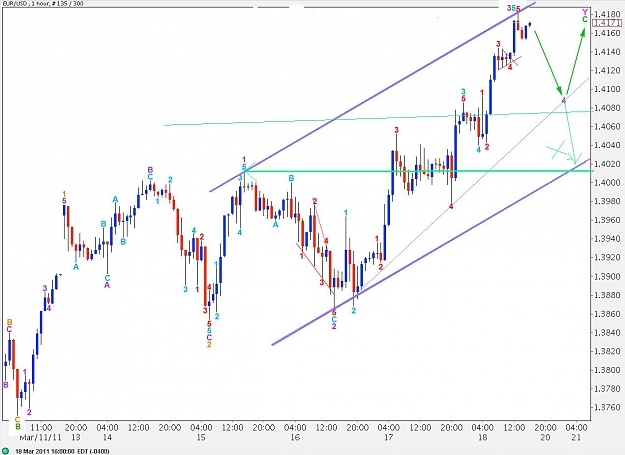
This is hourly chart take a review — hi this is hourly euro chart
Elliot wave, Harmonic And Ichimoku in CHINESE STYLE
- aman4forex replied Mar 21, 2011
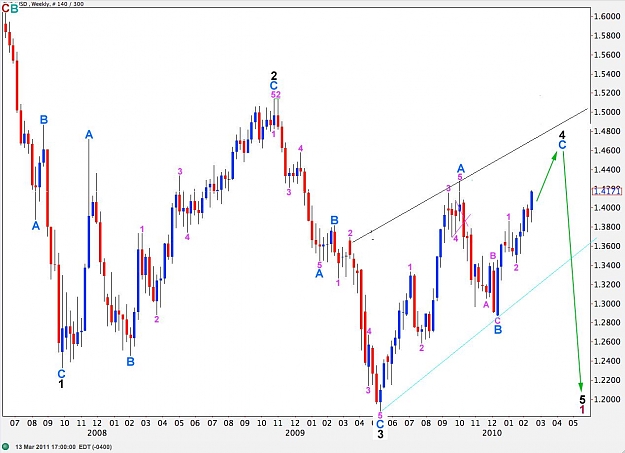
Thanks here is what I think — here is my long term idea...........but I expect a correctin before that happens as we are in 3rd strong wave............but in daily we need to confirm at 1.4282 for this chart to become valid
Elliot wave, Harmonic And Ichimoku in CHINESE STYLE
- Posts by Member Search: 'aman4forex'