- Search Metals Mine
- 60 Results (2 Threads , 58 Replies )
-
 KashifNawaz replied Jul 29, 2021
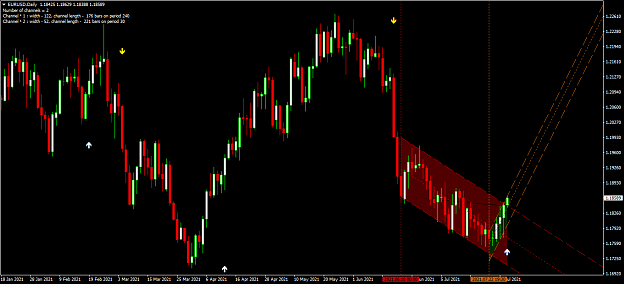
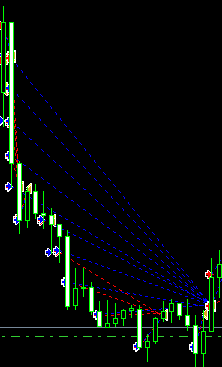
If Bulls can hold the price above 1.1850 level by end of NY session, EU will probably break the 45-day old bearish channel. Below chart on D1.
EURUSD only
- KashifNawaz replied Jul 26, 2021
Your numbers always give a clear indication for upcoming candles. My Kudos to your contribution.
EURUSD only
- KashifNawaz replied May 21, 2020
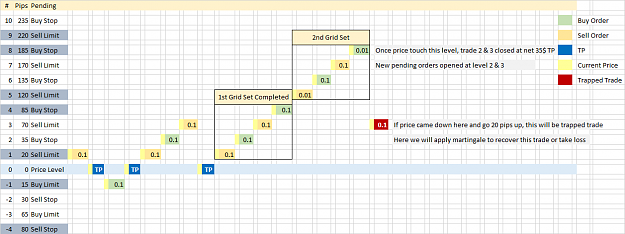
The below-given screenshot explains the idea image
Stop Your Limits (SYL)
- KashifNawaz replied May 20, 2020
Yes agree, demo servers give you a very friendly environment; however a good coded EA with good strategy will win.
Success with Martingale & Hedge - Possible?

- Stop Your Limits (SYL)Started May 20, 2020|Trading Discussion|10 replies

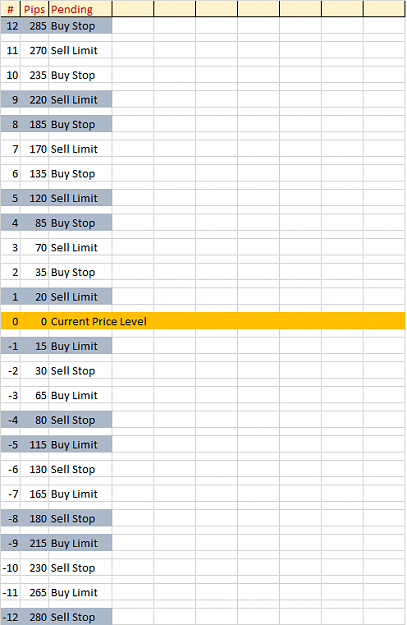
Let's say, a pair is in 1000 pips range for years, even 2000 pips we can trade SYL method and ...
- KashifNawaz replied May 2, 2019
Test Version of (Martingale / Anti-Martingale go side by side) Coded by Emonts. Test Results on EURUSD from 01-02-2015 till 31-05-2018 which includes following spikes 19-04-2018 / 30-05-2018 / 902 Pips 11-01-2018 / 29-01-2018 / 623 Pips 08-11-2016 / ...
Success with Martingale & Hedge - Possible?
- KashifNawaz replied Apr 28, 2019
Martingale Discussion to be continued................... So, the question was, how to REDUCE Dependability on Retracement to give more life and chances to Martingale. Obvious things are following; (we all know this). 1- Lowest initial lot (0.01 with ...
Success with Martingale & Hedge - Possible?
- KashifNawaz replied Mar 13, 2019
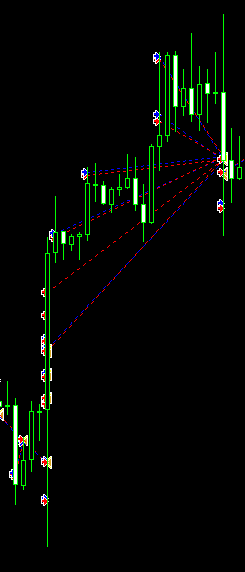
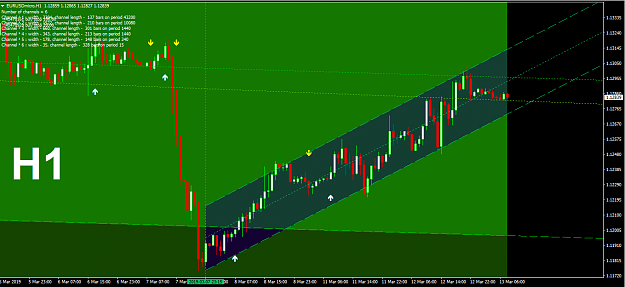
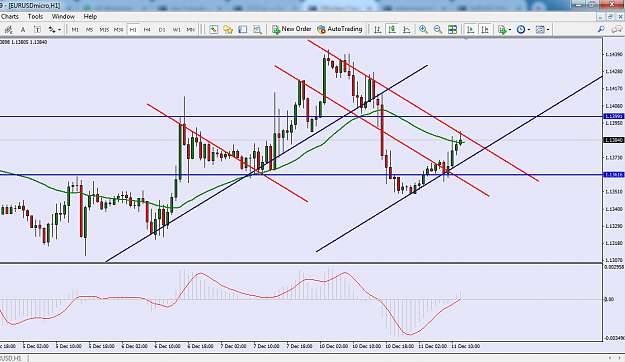
on H1, Bulls are still strong and we are in upward channel. Price is ranging between (1.1280 to 1.1295) both are center points of weekly bearish channel.
EURUSD only
- KashifNawaz replied Feb 3, 2019
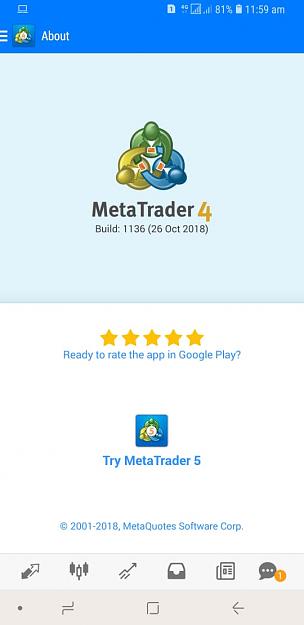
Thanks for your detailed post dear. I wonder, which MT4 version you are using because in my mobile version, I cannot see icon with the square, circle and triangle.
Effortless Trading Explained + FAQ I cannot even draw a simple trend line, angle line is still my dream ...
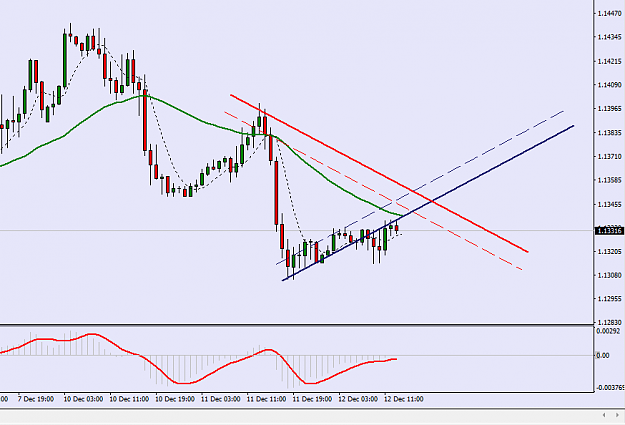
- KashifNawaz replied Dec 17, 2018
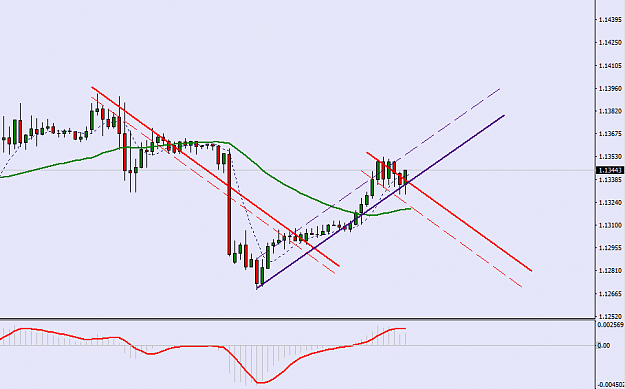
are you still using 36.9 angle TL? because with same angle, current Blue TL and dashed not possible
EURUSD only
- KashifNawaz replied Dec 12, 2018
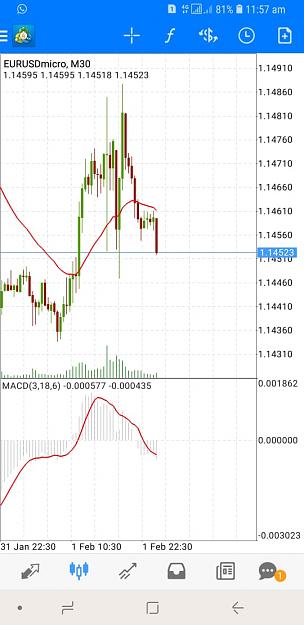
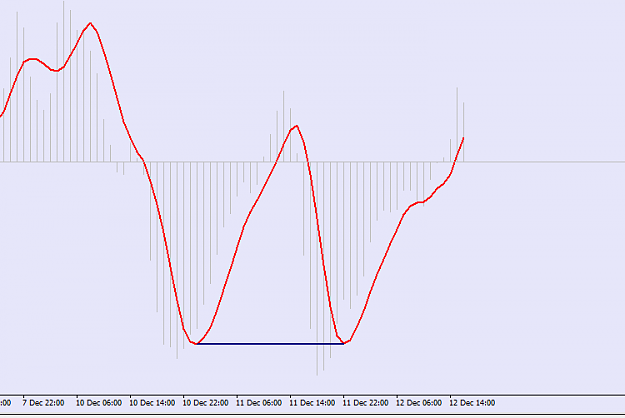
Friend, Since this morning, you have mentioned many times about divergence of MACD single line. What I see a straight light between two lowest recent point. Dont know why I cannot see any divergence there. Can you please explain this single line ine ...
EURUSD only
- KashifNawaz replied Dec 12, 2018
Thanks Ata for your detailed reply and explanation. It removed lot of confusions.
Effortless Trading Explained + FAQ Now I reached to page 4 and learned to draw Dashed Lines as well. I calibrated Blue TL based on your morning post in EU thread and also Target ...
- KashifNawaz replied Dec 11, 2018
Dear Ata, Millions of bundles of thanks for this thread. You are an awesome teacher and explains so well that leave very less room for confusions and questions. Your simple charts are the most attractive and meaningful. Die hard fan since long time. ...
Effortless Trading Explained + FAQ
- KashifNawaz replied Nov 14, 2018
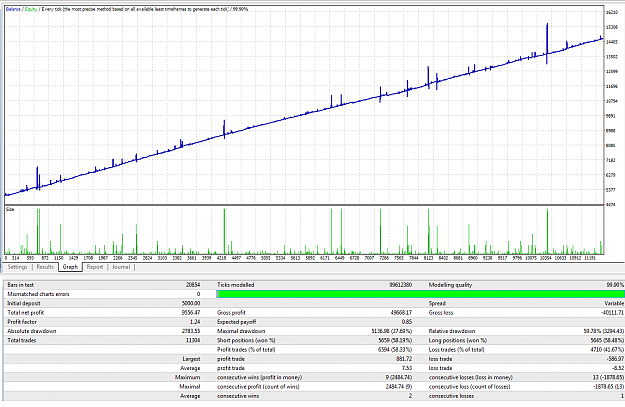
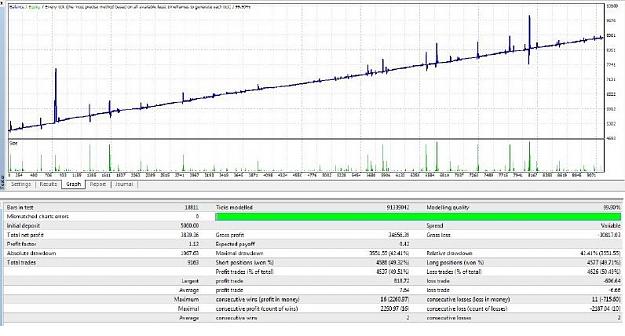
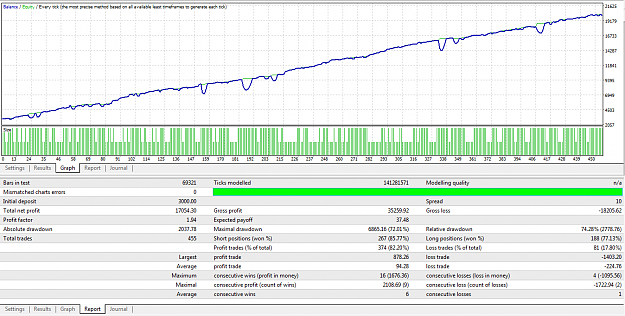
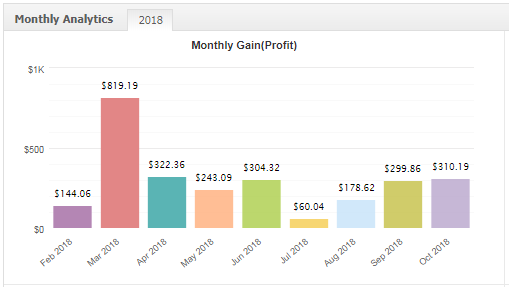
Back Test Results with Risky Setting (just to see quick results) Here are my Back Testing Results with 99.9% Modeling Quality Tick Data. Broker: XM (Standard Account) Leverage: 1:500 Pair: EURUSD Initial Deposit: 3000 Euro TimeFrame: 30m Date Range: ...
LRSF - TMS Expert Advisor
- KashifNawaz replied Oct 25, 2018
With 5000$ deposit, are you happy with earnings of 6%? average 300$ per month?
(binned per thread starter's request) MYMartingaleV1 EA
- KashifNawaz replied Oct 25, 2018
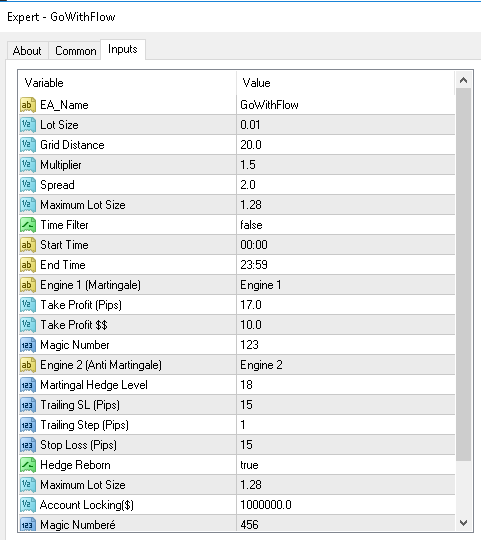
I will suggest, do your backtesting or forward testing in demo to get your own suitable setting. I am attaching here screen shot of setting which I am using for all 3 pairs on my demo account. I am not using account locking feature because I want to ...
Success with Martingale & Hedge - Possible?
- KashifNawaz replied Aug 13, 2018
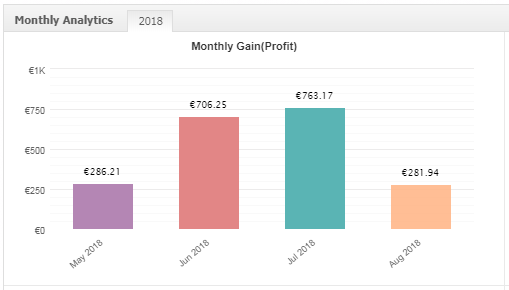
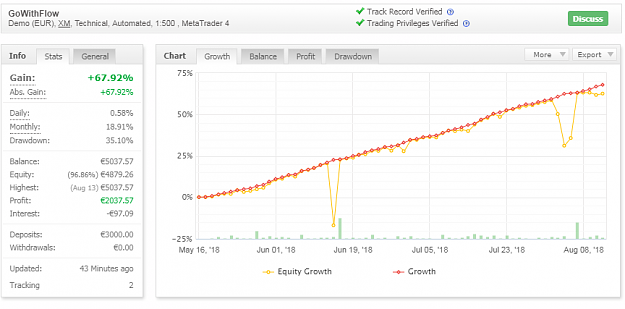
Current Performance of GoWithFlow v1 Average monthly income 700 Euro (not that much impressive but still okay) Max DD so far is 35% Its running on 3 pairs with conservative setting. To make it more aggressive, we need to decrease grid distance and ...
Success with Martingale & Hedge - Possible?
- KashifNawaz replied Jun 7, 2018
After reading VEEFX posts....... normal traders be like
Win in Trend and Win in Range


- KashifNawaz replied Jun 1, 2018
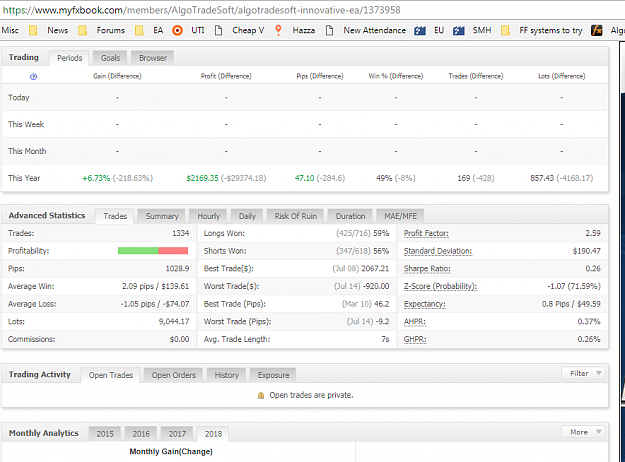
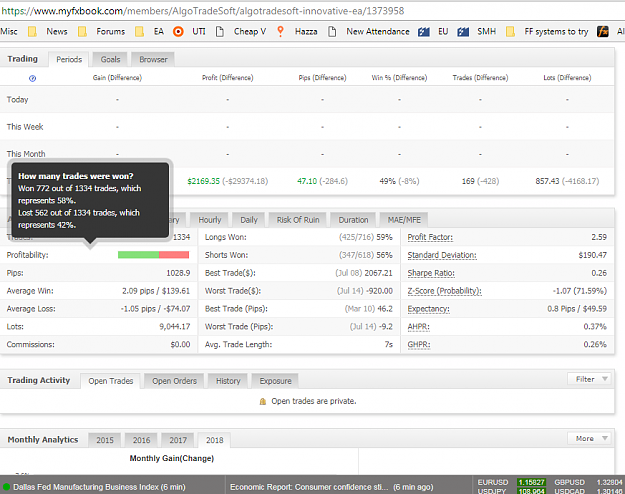
My findings from this Holy Grail real account. History is hidden but there are many things which may give us some light how he did this. Trading Period: Sep 11, 2015 till Mar 14, 2018 (Total 916 Days or 130 weeks) After deducting 261 off days, ...
Win in Trend and Win in Range
- KashifNawaz replied Jun 1, 2018
History is hidden but there are many things which may give us some light how he did this. Trading Period: Sep 11, 2015 till Mar 14, 2018 (Total 916 Days or 130 weeks) After deducting 261 off days, Working days 655 Total Trades: 1334 (Average Trades ...
Show me a profitable Expert Advisor!

