


Gold Price Forecast, Analysis and Charts:
- Old highs provide short-term resistance.
- Gold range constricted and needs a break.
Brand New Q4 2019 Gold Forecast and Top Trading Opportunities
DailyFX Interactive Global Commodities Infographic
Supportive Gold Trendline Holding for Now
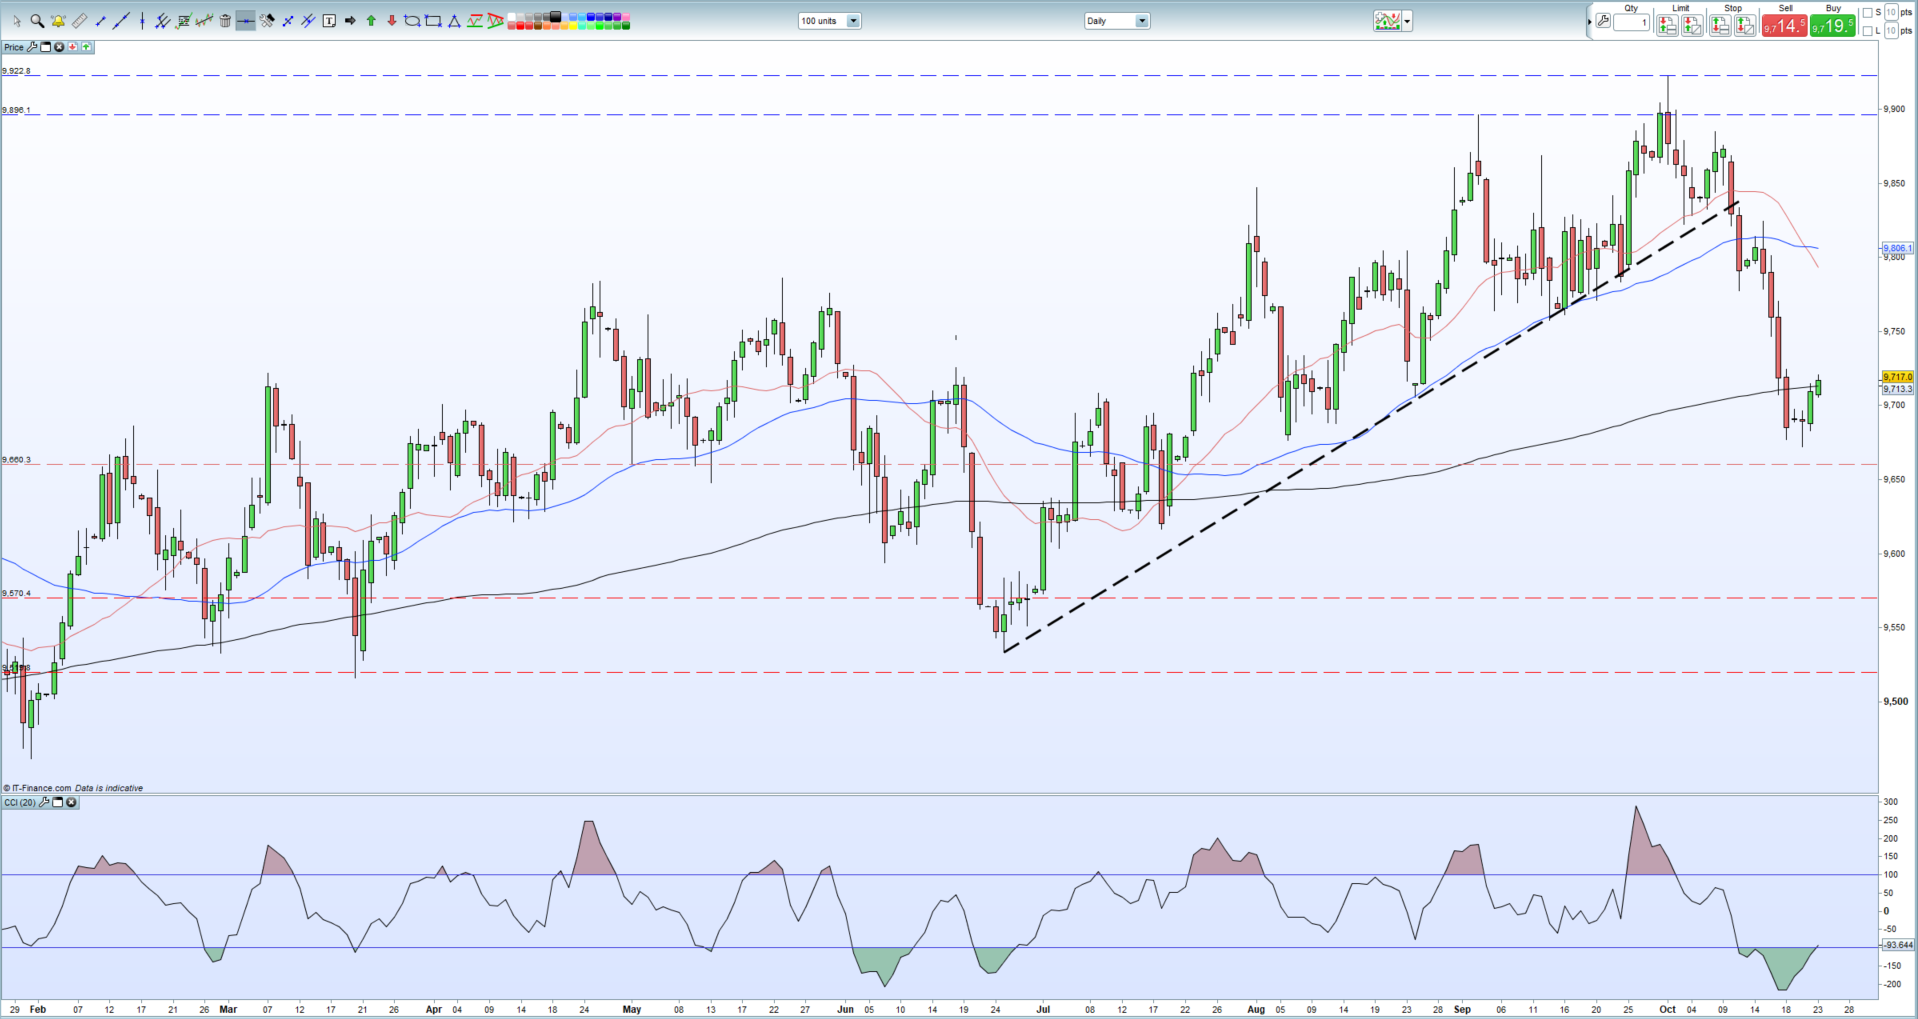
Gold is nudging higher Wednesday and continues to respect the support trendline started off the October 1 multi-week low at $1,458.5/oz. The precious metal has repeatedly tested this supportover the last two weeks but to date has not made a clean break and close below.
Gold Price Nears Breakout as Trendlines Continue to Merge – October 18
Gold is now running into a group of recent highs, all below $1,500/oz. as well as the 20-day moving average. Above here, the downtrend line off the September 4 multi-year high ($1,557/oz.) and the 50-day moving average meet at $1,504.5/oz. A break and close above here would open the way higher to $1,520/oz. The bullish pennant set-up is now around $20 from forming an apex, with a break expected shortly.
12 Interactive Trading Patterns
Gold Price Chart (March – October 23, 2019)

The US-China trade war continues despite recent commentary from the US that a deal is being put together and may be ready to sign in early November. China recently announced that it would use legitimate tariffs to the tune of USD2.4 billion against the US. The WTO ruled in July that the US did not remove tariffs on arrange of Chinese goods, leaving the way open for China to respond with retaliatory tariffs against the US.
How to Trade Gold: Top Gold Trading Strategies and Tips
US Dollar Running Into 200-Day Resistance
The recent pick-up in the US dollar basket (DXY) off its three-month low is now running into resistance in the form of the 200-day moving average. A break and close above should open the way for the US dollar to retrace recent losses back to the 97.75 area. A stronger USD normally pushes gold lower.
US Dollar Basket (DXY) Daily Price Chart (February – October 23, 2019)
IG Client Sentiment shows that how traders are positioned in a wide range of assets and markets.
Traders may be interested in two of our trading guides – Traits of Successful Traders and Top Trading Lessons – while technical analysts are likely to be interested in our latest Elliott Wave Guide.
What is your view on Gold – bullish or bearish?? You can let us know via the form at the end of this piece or you can contact the author at nicholas.cawley@ig.com or via Twitter @nickcawley1.


