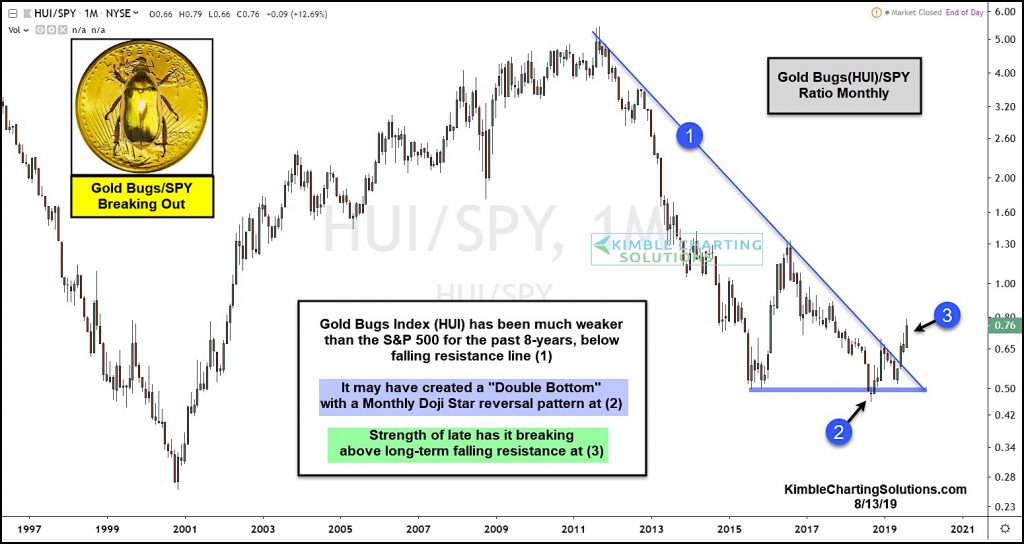
Gold Bugs HUI / S&P 500 ETF Ratio Chart – INDEXNYSEGIS: HUI / NYSEARCA: SPY
Gold NYSEARCA: GLD has rallied back to multi-year highs over $1500.
And this has Gold bugs and the Gold Bugs Index feeling awfully bullish.
In today’s chart we look at an important ratio for metals bulls: the Gold Bugs / S&P 500 ratio. The ratio has been in a downtrend for the past 8 years at (1).
So Gold bugs get excited when the index outperforms the S&P 500 (bullish).
Looking at the chart, you can see that this ratio may have double bottomed over the past few years (2). As well, the ratio is breaking out above its 8-year falling resistance line (3).
Metals bulls would love to see dips bought and follow through higher. Stay tuned!
Note that KimbleCharting is offering a 2 week Free trial to See It Market readers. Just send me an email to services@kimblechartingsolutions.com for details to get set up.
Twitter: @KimbleCharting
Any opinions expressed herein are solely those of the author, and do not in any way represent the views or opinions of any other person or entity.


