


Gold (XAU) and Silver (XAG) Price Analysis and Charts.
DailyFX Q2 Forecasts and Top 2019 Trading Opportunities.
Gold (XAU) Price Respecting Lower Highs
The price of gold is currently trading just below a series of lower highs initiated off the February 20 peak at $1,346/oz. after bouncing off support from the 200-day moving average on Tuesday this week. The narrowing of the recent trading range may provoke a break-out in the coming days with $1,287/oz, the 61.8% Fibonacci retracement level and this week’s high the first level of resistance. To break the series of lower highs, gold needs to trade above the May 14 high at $1,303/oz, a level that will need a strong fundamental driver to be breached. To the downside, the 200-day moving average is currently around $1,270.5/oz. This technical indicator held and prompted a reversal on Tuesday this week, although the rebound was short-lived. Below here, $1,266/oz. stands in the way of a re-test of 50% Fibonacci retracement at $1,262.8/oz.
How to Trade Gold: Top Gold Trading Strategies and Tips
Gold (XAU) Daily Price Chart (May 2018 – May 24, 2019)

Silver (XAG) – Bear Channel Still in-Play
Silver bounced off a six-month low at $14.38 earlier this week and pushed marginally higher but the move still looks weak as a new lower low and a lower high were put in place. Silver continues to respect the downtrend and a re-test of this week’s low is possible if bearish momentum continues. Silver has also been respecting the 20-day moving average since late-March, while both the shorter-dated moving averages fell through the longer-dated (200-day) ma recently, adding to bearish sentiment. A break lower would target, $14.05, the November 30 low, psychological support at $14.00 before a full re-trace back to the November 14 low at $13.89.
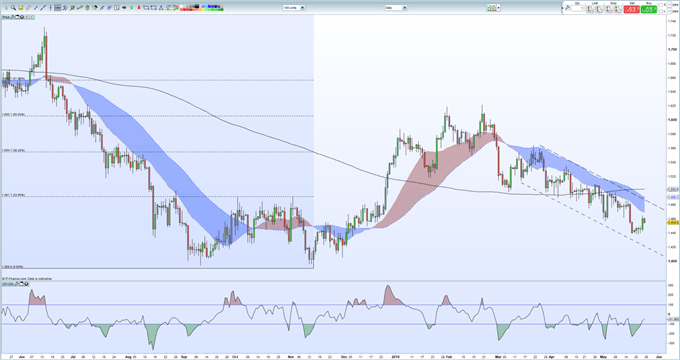
Silver (XAG) Daily Price Chart (August 2018 - May 24, 2019)
Trading the Gold-Silver Ratio: Strategies and Tips.
IG Client Sentiment shows that retail traders are 78.8% net-long gold, a bearish contrarian indicator. Recent daily and weekly sentiment shifts however give us a mixed trading bias.
--- Written by Nick Cawley, Market Analyst
To contact Nick, email him at nicholas.cawley@ig.com
Follow Nick on Twitter @nickcawley1


