
Advertisement
Advertisement
Gold Price Futures (GC) Technical Analysis – May 16, 2019 Forecast
By:
Based on the early price action and the current price at $1291.10, the direction of the June Comex gold market on Thursday is likely to be determined by trader reaction to the 50% level at $1291.30.

Gold futures are trading lower on Thursday, pressured by a jump in U.S. Treasury yields, a firmer U.S. Dollar and increased demand for risky assets. The catalysts behind the rally in these three markets are hope of a trade deal between the United States and China, and better-than-expected U.S. economic data.
At 14:09 GMT, June Comex gold futures are trading $1291.10, down $6.70 or -0.52%.
Long liquidation is also behind the selling pressure with many traders getting pulled into the market on so-called “safe-haven” buying due to geopolitical concerns. These traders are being forced to exit losing trades, adding further to the downside pressure.
Daily Technical Analysis
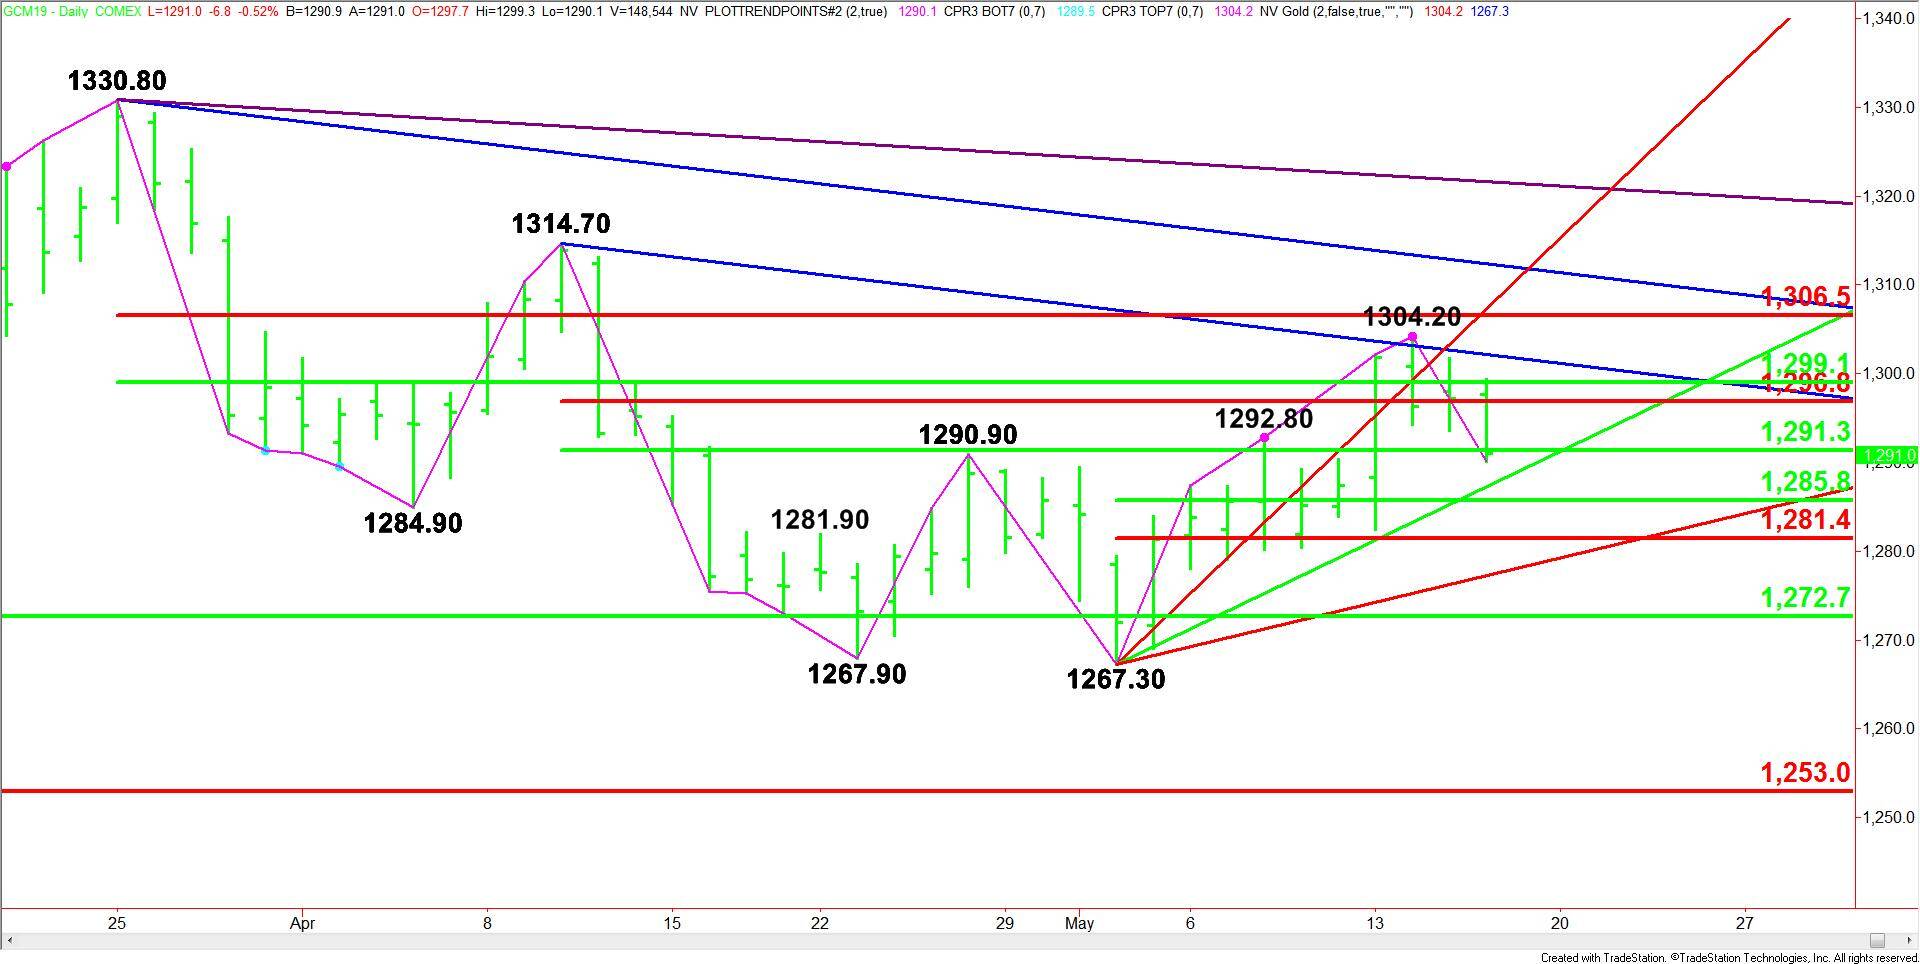
The main trend is up according to the daily swing chart. However, momentum has been trending lower since the formation of the closing price reversal top at $1304.20 on May 14.
A trade through $1304.20 will negate the closing price reversal top and signal a resumption of the uptrend. A move through $1267.30 will change the main trend to down. However, this is highly unlikely today. However, there is still room for a normal 50% to 61.8% correction.
The price action is also being controlled by a series of retracement levels.
On the upside, resistance is a short-term Fibonacci level at $1296.80, a main 50% level at $1299.10 and a main Fibonacci level at $1306.50.
On the downside, the next target zone comes in at $1285.80 to $1281.40, followed by a major support zone at $1272.70 to $1253.00.
Daily Technical Forecast
Based on the early price action and the current price at $1291.10, the direction of the June Comex gold market on Thursday is likely to be determined by trader reaction to the 50% level at $1291.30.
Bearish Scenario
A sustained move under $1291.30 will indicate the selling pressure is getting stronger. This could trigger a break into the uptrending Gann angle at $1287.30, followed by the 50% level at $1285.80. If this fails then prices could continue to retreat into the short-term Fib level at $1281.40.
Since the main trend is up, look for buyers to come in on a test of $1285.80 to $1281.40.
Bullish Scenario
A sustained move over $1291.30 will signal the return of buyers. This could trigger a retest of $1296.80 to $1299.10.
Although buyers could come in on a test of $1285.80 to $1281.40, the market isn’t likely to rally unless buyers get some help from a weaker U.S. Dollar, falling Treasury yields and lower demand for risky assets.
About the Author
James Hyerczykauthor
James is a Florida-based technical analyst, market researcher, educator and trader with 35+ years of experience. He is an expert in the area of patterns, price and time analysis as it applies to futures, Forex, and stocks.
Did you find this article useful?
Latest news and analysis


Advertisement