
Advertisement
Advertisement
Gold Price Futures (GC) Technical Analysis – Inside Trade Indicates Investor Indecision, Renewed Volatility
By:
Based on the pair of inside days, we have to conclude that the direction of the December Comex gold market on Thursday is likely to be determined by trader reaction to Tuesday’s high at $1247.50 and its low at $1235.80.

Gold futures are trading nearly flat on Thursday after giving back earlier gains. Investors are being influenced by the price action in the U.S. Dollar Index, while ignoring another steep drop in U.S. Treasury yields and a plunge in U.S. stock indexes. The price action is actually a little confusing which suggests safe-haven buying is underpinning the U.S. Dollar, which is making gold a less-desirable asset.
At 0648 GMT, February Comex Gold is trading $1241.80, down $0.80 or -0.07%.
Daily Swing Chart Technical Analysis
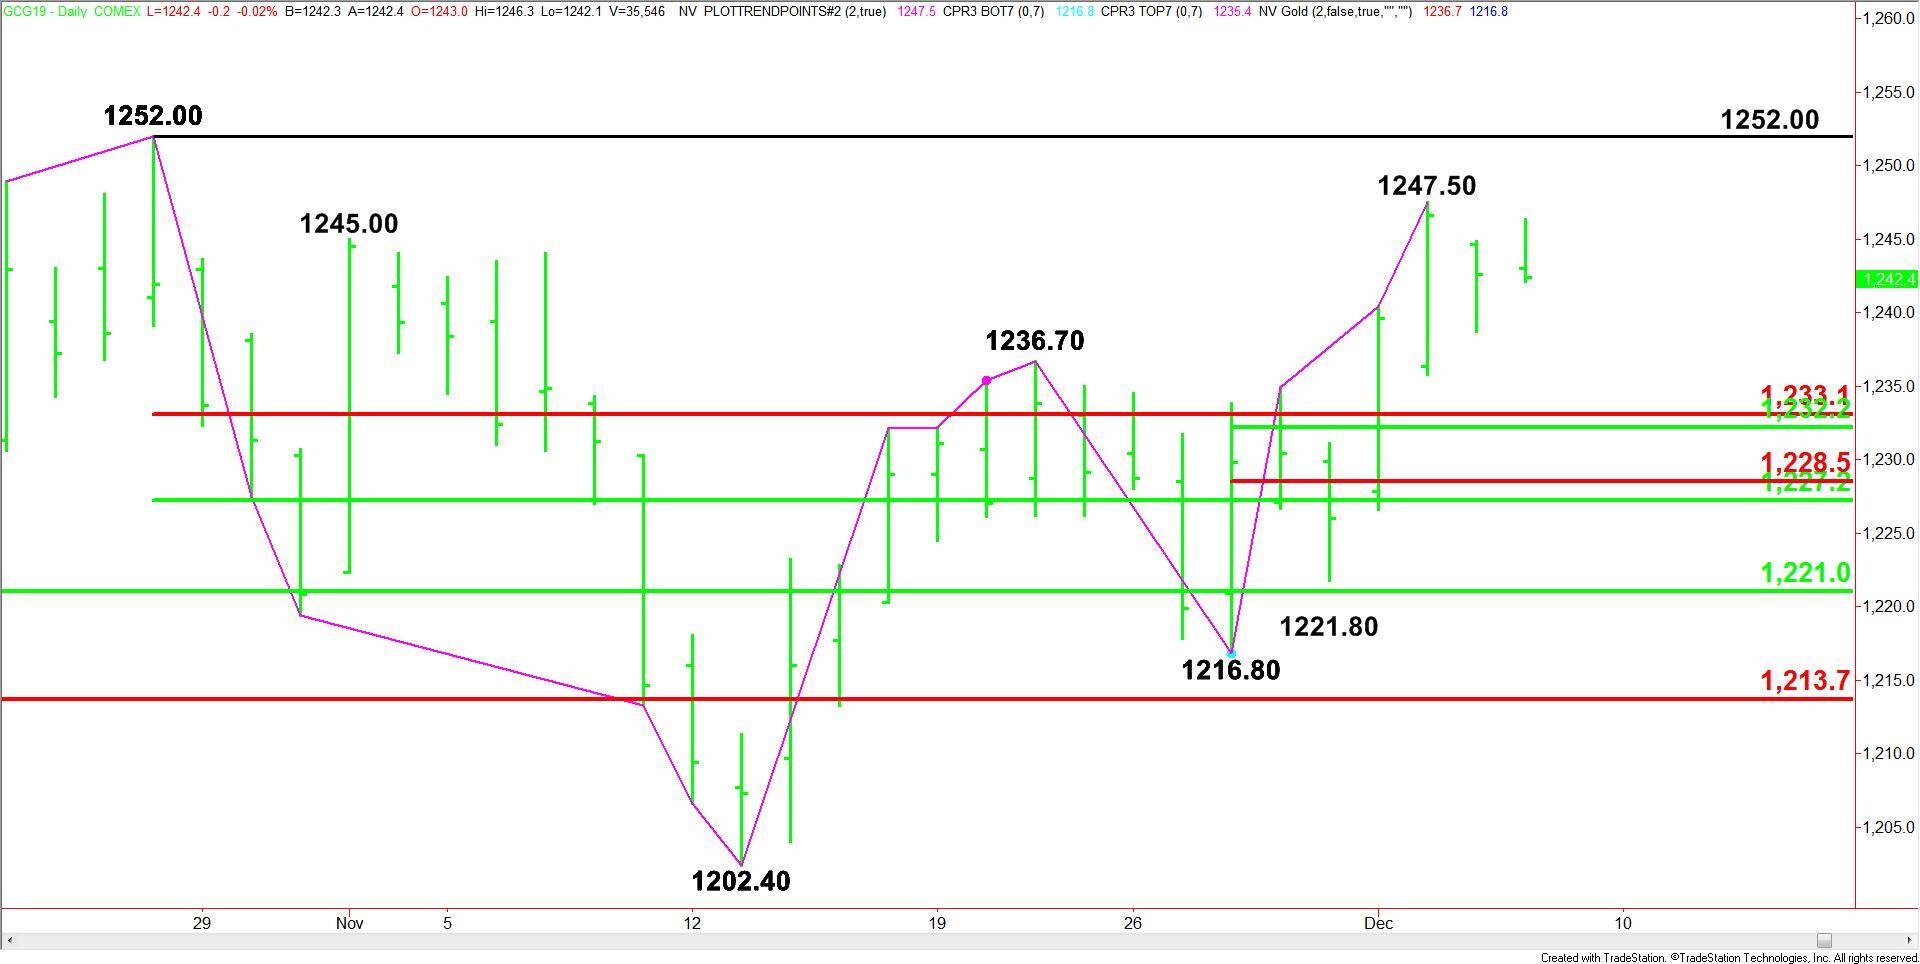
The main trend is up according to the daily swing chart. A trade through $1247.50 will signal a resumption of the uptrend. This could trigger a rally into the October 26 main top at $1252.00. The daily chart is wide open over this top with $1284.00 the next major upside target.
The market is also trading inside Tuesday wide range for a second session. This tends to indicate investor indecision and impending volatility. In this case, the price action is being influenced by the U.S. Dollar’s choppy trade.
Trading above major and minor retracement price clusters at $1233.10 to $1232.20 and $1228.50 to $1227.20 is helping to give the market an upside bias.
Daily Swing Chart Technical Forecast
Based on the pair of inside days, we have to conclude that the direction of the December Comex gold market on Thursday is likely to be determined by trader reaction to Tuesday’s high at $1247.50 and its low at $1235.80.
Bullish Scenario
A trade through $1247.50 will indicate the return of buyers. If this move creates enough upside momentum then look for the rally to continue into $1252.00. Taking out this top with conviction will be bullish since the daily chart indicates there is room to run with $1284.10 the next major upside target.
Bearish Scenario
A failure to follow-through to the upside over $1247.50 will indicate the presence of sellers, but a move through Tuesday’s low at $1235.80 is likely to trigger a breakdown. If this creates enough downside momentum then look for the selling to extend into $1233.10 to $1232.20. If this fails then the selling is likely to extend into $1228.50 to $1227.20.
About the Author
James Hyerczykauthor
James is a Florida-based technical analyst, market researcher, educator and trader with 35+ years of experience. He is an expert in the area of patterns, price and time analysis as it applies to futures, Forex, and stocks.
Did you find this article useful?
Latest news and analysis


Advertisement