5 Charts That Are Front Of Mind

Gold
The yellow metal spiked to new record highs in early trade in the small hours of Monday morning, having broken above $2,075/oz at the fourth time of asking. However, short of being the continuation of the recent move higher, the break proved short-lived, with sellers prevailing amid incredibly thin liquidity, fading the rally, and seeing gold end the day around 2% lower in the spot market. Incidentally, the near-6% high-low range printed to start the week was the widest since September 2020.
Of course, the key question is where gold now heads next. In many ways, the rejection of Monday’s rally, and close back below the prior high, could be considered the first sign that the liquidity-driven ‘buy everything’ rally that markets have staged since early-November may be coming close to an end. Furthermore, with the USD showing some signs of life once more, and risks to Treasuries now appearing much more two-sided, the bull case for the yellow metal is looking somewhat shakier. Reclaiming the $2,075/oz level on a closing basis will be key to unlocking further upside, while any dips under the $2,000/oz handle should entice more sellers to enter the fray.
_go_2023-12-05_11-03-49.jpg)
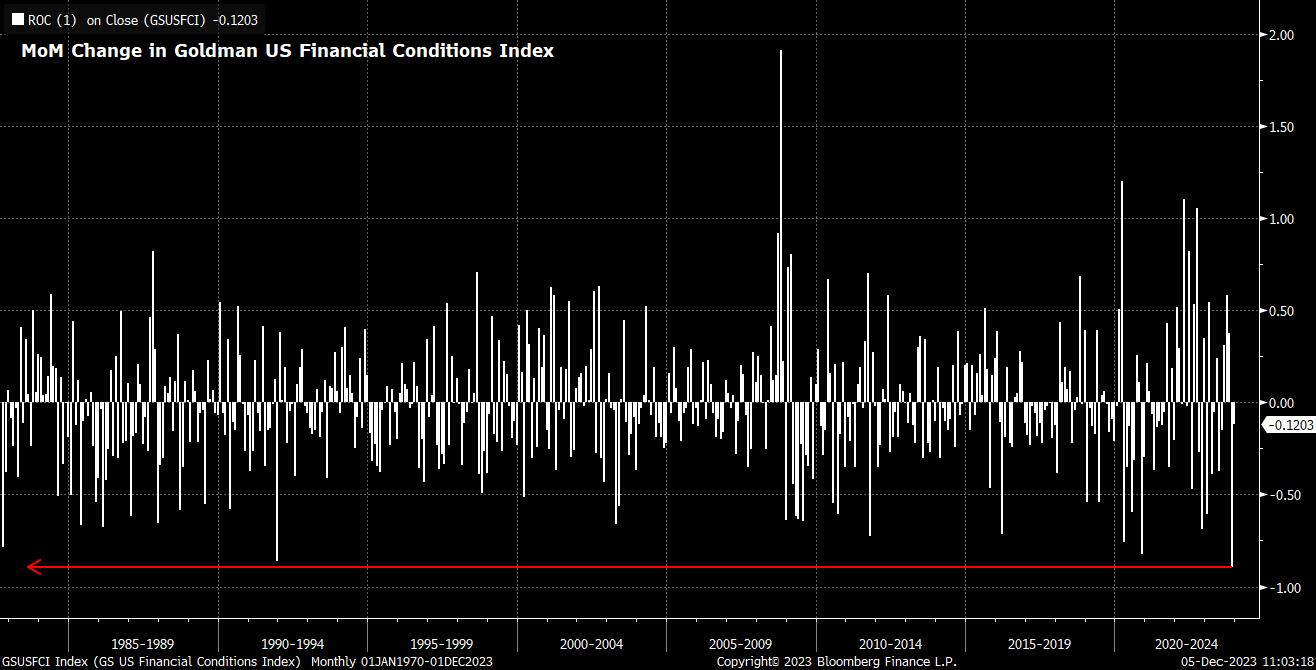
US Financial Conditions
One consequence of the ‘buy everything’ theme that dominated financial markets last month was a significant easing in financial conditions – probably the last thing that policymakers would want to see at this point in the cycle, with inflation remaining north of the 2% target in almost all G10 economies. Goldman’s index of US financial conditions, for instance, notched its biggest one-month fall since inception last month, a move that is – using ‘back of the envelope’ maths – equivalent to over three 25bp cuts in the fed funds rate.
Clearly, such a significant easing in conditions raises the prospect of policymakers pushing back, both against this, and the market’s aggressive pricing of rate cuts in 2024, with futures implying as much as 130bp of easing to be delivered next year. This poses an interesting challenge for policymakers heading into the December FOMC meeting next week, with guidance likely to shift to confirm that the tightening cycle has now reached its conclusion, but Committee members likely erring on the side of caution in terms of the ‘dot plot’, to avoid a further significant easing, running the risk of inflation making a resurgence. Any pushback on current market pricing poses upside risks to the USD, and downside risks to equities.
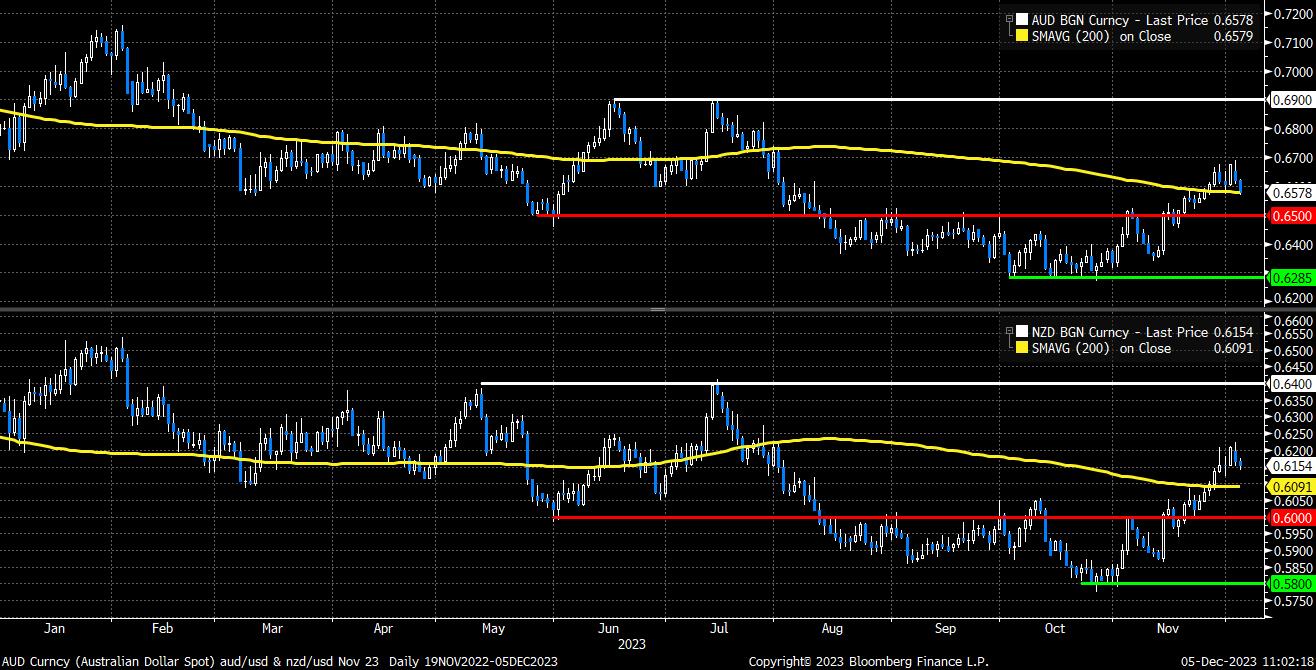
AUD & NZD
As already noted, the USD has softened significantly of late, as the macro backdrop increasingly moves towards the middle of the ‘dollar smile’, with incoming data showing increasing signs of the labour market softening, and economic growth ‘catching down’ to that seen in G10 peers. Those USD gains have, by and large, been most obvious in higher-beta areas of the market, particularly the AUD and NZD, with risk sensitive currencies also getting a helping hand from continued strength in stocks, after the S&P 500 notched a five-week winning run.
Signs, though, are beginning to emerge that a turning in the tide could be on the cards. After a less hawkish than expected RBA decision, where the tightening bias was somewhat watered down, the AUD is now testing the all-important 200-day moving average to the downside, with a closing break below this level likely leading the bears to target a return to the 65 figure. Though the NZD has proved a little more resilient, sellers are also seeking to prevail here, with a move north of the 62 handle having failed despite three attempts.
JPY Uptrend
The JPY has found itself – along with gold, of course – as one of the biggest beneficiaries of the recent rally in Treasuries, as markets increasingly buy into the belief that the Fed’s tightening cycle is at an end, and that the next move in the fed funds rate will be lower. The rally sees USD/JPY trade around 5 big figures below the cycle highs seen during the middle of last month, levels at which there was much speculation that the MoF had intervened, primarily via conducting numerous ‘rate checks’.
In any case, the JPY now tests an intriguing level, that being the uptrend that’s been in place since late in Q1, almost bang on the 147 handle. Consensus heavily favours further JPY strength over the next 12 months, not least owing to the likelihood that, at long last, 2024 will mark the year that the Bank of Japan bring decades of ultra-easy policy to an end. While such an exit is almost certain to be slow, and gradual, in nature, it will likely come at a time when almost all other G10 central banks are actively beginning to ease policy. Positioning for such a theme is likely already under way, and would be set to gather increasing momentum on a break below this key uptrend.
_j_2023-12-05_11-01-56.jpg)
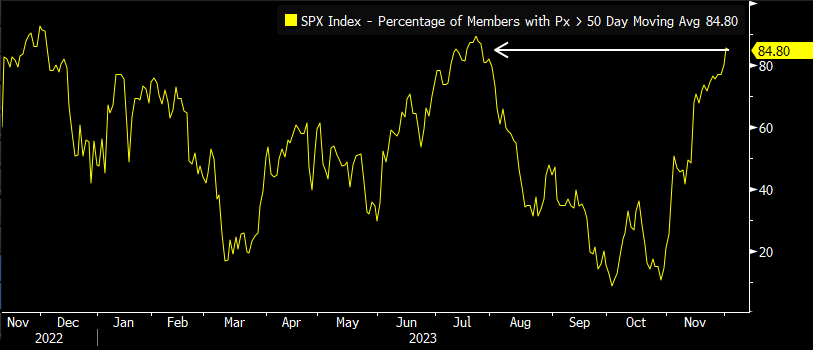
Market Breadth
Poor market breadth has been a significant concern for many this year, with countless column inches having been taken up by the dominance of the ‘Magnificent Seven’ within the S&P 500, which have underpinned the broader index’s impressive 20% YTD gain. Of late, however, some signs have begun to emerge that market breadth is beginning to improve, as the end of the year nears. For instance, the proportion of S&P 500 members trading above their 50-day moving averages now sits at almost 85%, the highest such level since late-July.
This implies a greater, and broader, degree of participation in some of the recent upside that equities have seen, perhaps as portfolio managers embark on the traditional year-end ‘window dressing’ process, with some portfolio rebalancing thrown in for good measure. A further improvement in breadth would likely provide a further fillip for equities into year-end, where seasonality also typically provides a positive impetus.
Related articles


The material provided here has not been prepared in accordance with legal requirements designed to promote the independence of investment research and as such is considered to be a marketing communication. Whilst it is not subject to any prohibition on dealing ahead of the dissemination of investment research we will not seek to take any advantage before providing it to our clients.
Pepperstone doesn’t represent that the material provided here is accurate, current or complete, and therefore shouldn’t be relied upon as such. The information, whether from a third party or not, isn’t to be considered as a recommendation; or an offer to buy or sell; or the solicitation of an offer to buy or sell any security, financial product or instrument; or to participate in any particular trading strategy. It does not take into account readers’ financial situation or investment objectives. We advise any readers of this content to seek their own advice. Without the approval of Pepperstone, reproduction or redistribution of this information isn’t permitted.