
Advertisement
Advertisement
Gold’s Retracement May Have Ended: Technical Analysis Points to Likely Bullish Trend Continuation
By:
Gold's retracement appears to be nearing its end as technical analysis signals a potential continuation of the bullish trend, supported by key levels and patterns.

In this article:
Gold Forecast Video for 07.06.23 by Bruce Powers
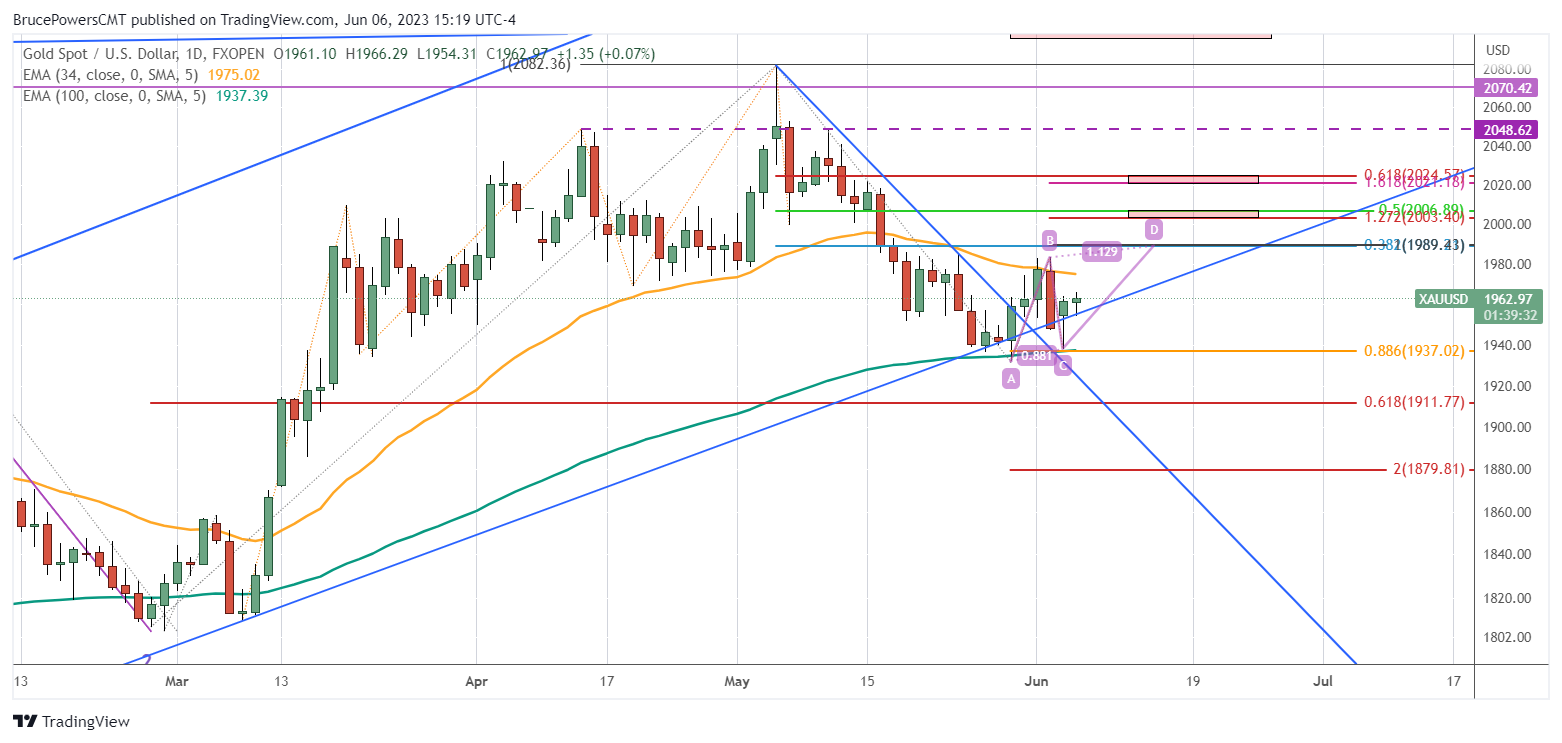
We have been watching gold for signs that its current retracement may be coming to an end. It certainly looks like it is getting closer. Monday, saw gold pullback further to eventually find support at a 1,938 low, which completed an 88.6% Fibonacci retracement (1,937). Subsequently, by the end of the day a bullish hammer reversal candlestick pattern occurred.
Strong Support Indicated at Last Week’s Low
There are a couple technical reasons why last week’s low could be an important low for gold and might be the low for some time. The low for the retracement to date occurred at 1,932. That was at the confluence of the long-term uptrend line and the 100-Day EMA. Each a dynamic support line for the developing uptrend. The 100-Day line was tested a second time yesterday as it lines up with the 88.6% retracement area.
Signs of Strength as Gold Rallies Above Monday’s High
Next, we watch for further signs of strength. The first came today as gold rallied above Monday’s 1,964 high. A daily close above that high will provide another clue indicating that underlying demand is improving. Resistance was seen last week at a high of 1,983, and near resistance represented by the 34-Day EMA, now at 1,975. Gold was unable to close above the 34-Day line on a daily basis, thus leading to a selloff. Therefore, a daily close above the 34-Day EMA is a new sign of strength. Once followed by a daily close above last week’s high, gold will have triggered a bullish trend continuation.
Initial Upside Targets
Yesterday’s low provides the point for the C leg of a rising ABCD pattern. The CD and AB legs match at an initial target of 1,989, which matches the 38.2% Fibonacci retracement. Given that two pieces of analysis mark a similar price, that target zone has a good chance of being hit. Subsequent extension targets from the ABCD pattern are close to higher Fibonacci retracement levels, thereby creating target zone. They have been highlighted in red on the chart. The 127.2% Fibonacci extension of the CD leg is at 2,003 and includes a price range up to the 50% retracement at 2,007. While the 161.8% extension is at 2,021 along with the 61.8% retracement at 2,025.
For a look at all of today’s economic events, check out our economic calendar.
About the Author
Bruce Powersauthor
Bruce boasts over 20 years in financial markets, holding senior roles such as Head of Trading Strategy at Relentless 13 Capital and Corporate Advisor at Chronos Futures. A CMT® charter holder and MBA in Finance, he's a renowned analyst and media figure, appearing on 150+ TV business shows.
Did you find this article useful?
Latest news and analysis


Advertisement